Analysis
February 7, 2025
US steel imports inch up in December, surge in January
Written by Brett Linton
Following the one-year low recorded in November, steel imports rose by 3% in December to 2.14 million short tons (st), according to final US Commerce Department data. Although December marks the second-lowest monthly import rate of 2024, it is slightly higher than volumes seen one year prior.
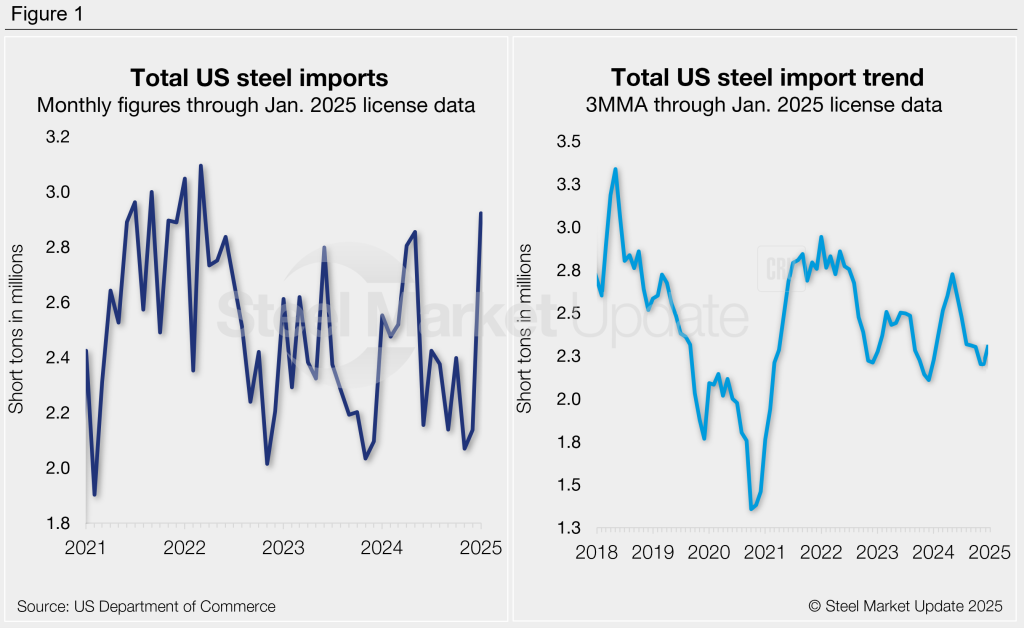
According to license data collected through Feb. 3, January import licenses total 2.92 million st (Figure 1, left). That potential 37% month-over-month (m/m) rebound means January could be the highest month for steel imports witnessed in nearly three years.
Nearly half of the steel that entered the US in December was exported from just three countries: Canada (24%), Mexico (15%), and South Korea (10%). Other key suppliers included Brazil, Vietnam, Romania, Germany, Taiwan, Japan, and China. Combined shipments from these ten countries accounted for 80% of December imports.
Import trends
Import data can be analyzed on a three-month moving average (3MMA) basis to better highlight long-term trends (Figure 1, right). From this perspective, December imports fell to the lowest level of 2024 at 2.20 million st. The January 3MMA is currently up to 2.38 million st. For comparison, imports averaged 2.41 million st per month in 2024 and 2.35 million st per month in 2023.
Finished vs. semi-finished imports
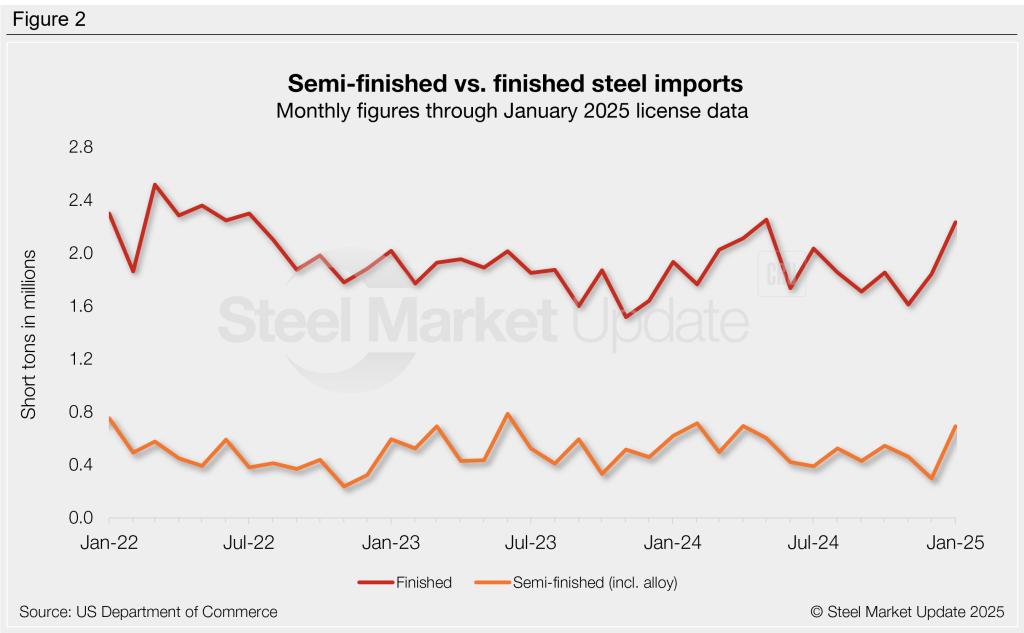
Imports of finished steel products also rebounded in December, rising 14% m/m to 1.84 million st (Figure 2). The count through January shows a potential 21% increase to 2.23 million st, which would be an eight-month high. Finished imports averaged 1.89 million st per month in 2024 and 1.83 million st per month in 2023.
Meanwhile, semi-finished steel imports (mostly slabs to be further processed by a mill) fell to a two-year low of 296,000 st in December, down 36% m/m. January licenses currently show a 133% recovery to 691,000 st. Semi-finished imports averaged 515,000 st per month in 2024 and 524,000 st per month in 2023.
Imports by category
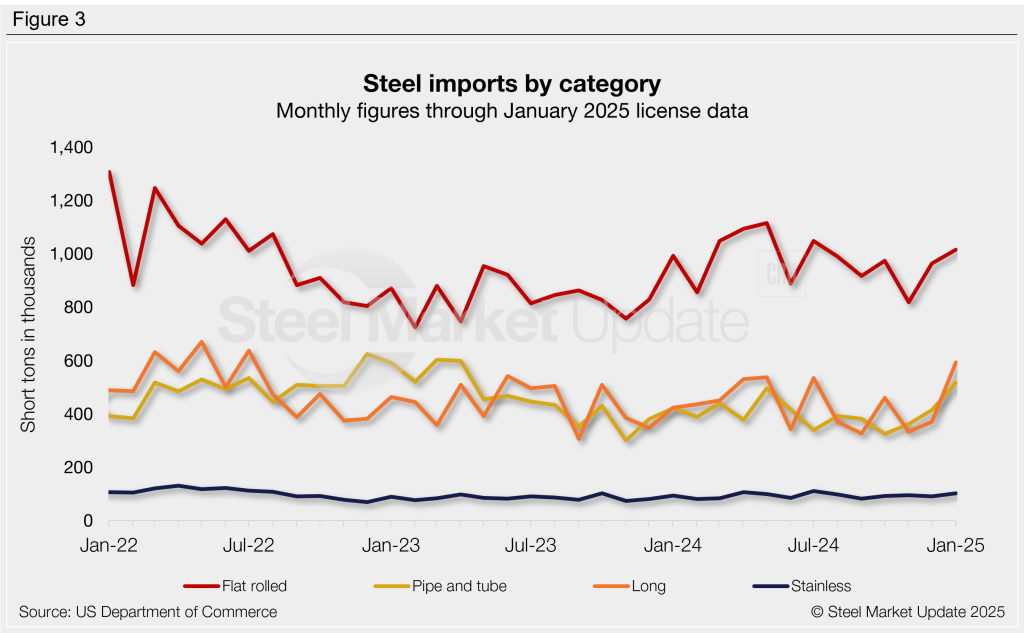
Figure 3 shows monthly imports by popular steel product categories. Noteworthy mentions by category include:
- Flat-rolled imports jumped 18% m/m in December following November’s one-year low. January licenses currently show a potential 5% m/m recovery to the highest rate seen in six months.
- Imports of long products rose 11% m/m in December. January licenses are currently up a whopping 60% from December to a two-and-a-half-year high.
- Pipe and tube imports increased 15% m/m in December, the highest rate seen in six months. January licenses are currently up another 25% m/m to a potential 21-month high.
- December stainless imports fell 4% m/m, while January projections are currently up 13% m/m to a six-month high.
Flat-rolled imports
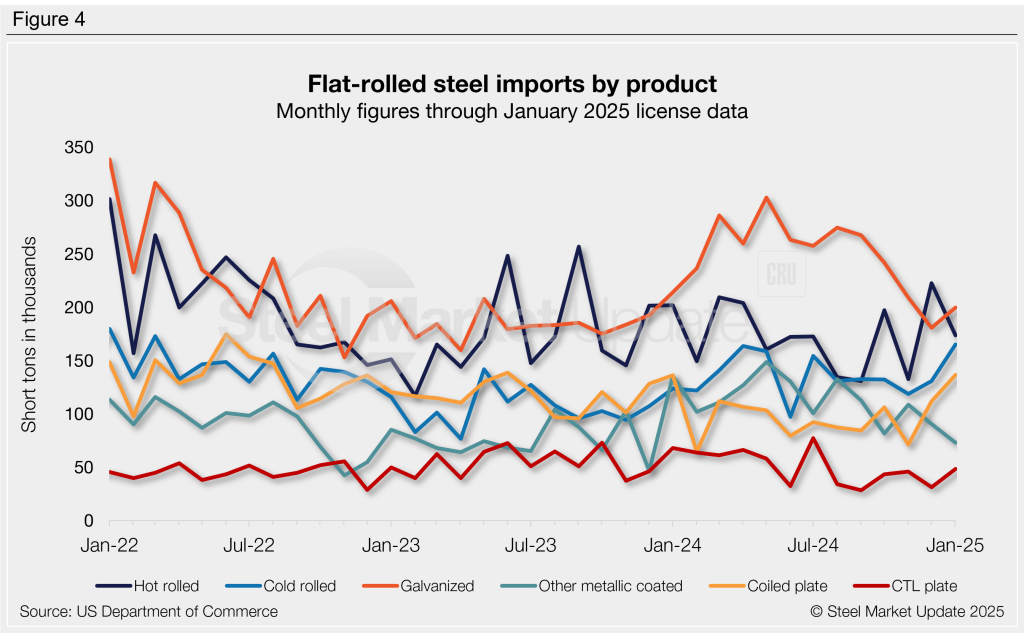
Figure 4 shows flat rolled imports by popular products. Five products saw weakening imports from October to December, while two products increased. January licenses are mixed with some up and some down. Noteworthy mentions by product include:
- Hot-rolled coil imports jumped 68% m/m in December to a 15-month high. January licenses are currently down 22% m/m.
- Cold-rolled coil imports rebounded 10% m/m in December from November’s five-month low. License data through January shows a 26% m/m increase, potentially the highest monthly rate seen since March 2022.
- Galvanized imports fell 14% m/m in December to a 14-month low. Levels have partially recovered through January, with licenses currently up 10% m/m.
- Other-metallic coated imports slipped 17% in December. January licenses are down another 19% m/m to a potential 13-month low.
- Coiled plate imports surged 57% m/m in December to an 11-month high. January licenses are up even further, increasing 22% m/m to a possible year-and-a-half high.
- Cut-to-length (CTL) plate imports fell 32% m/m in December, marking one of the lowest rates seen in the past four years. January license data currently shows a 55% m/m recovery, possibly shifting to a six-month high.
- Tin plate imports rebounded 61% m/m in December to a four-month high. January licenses are up 8% m/m, the highest monthly rate in our limited six-year history.
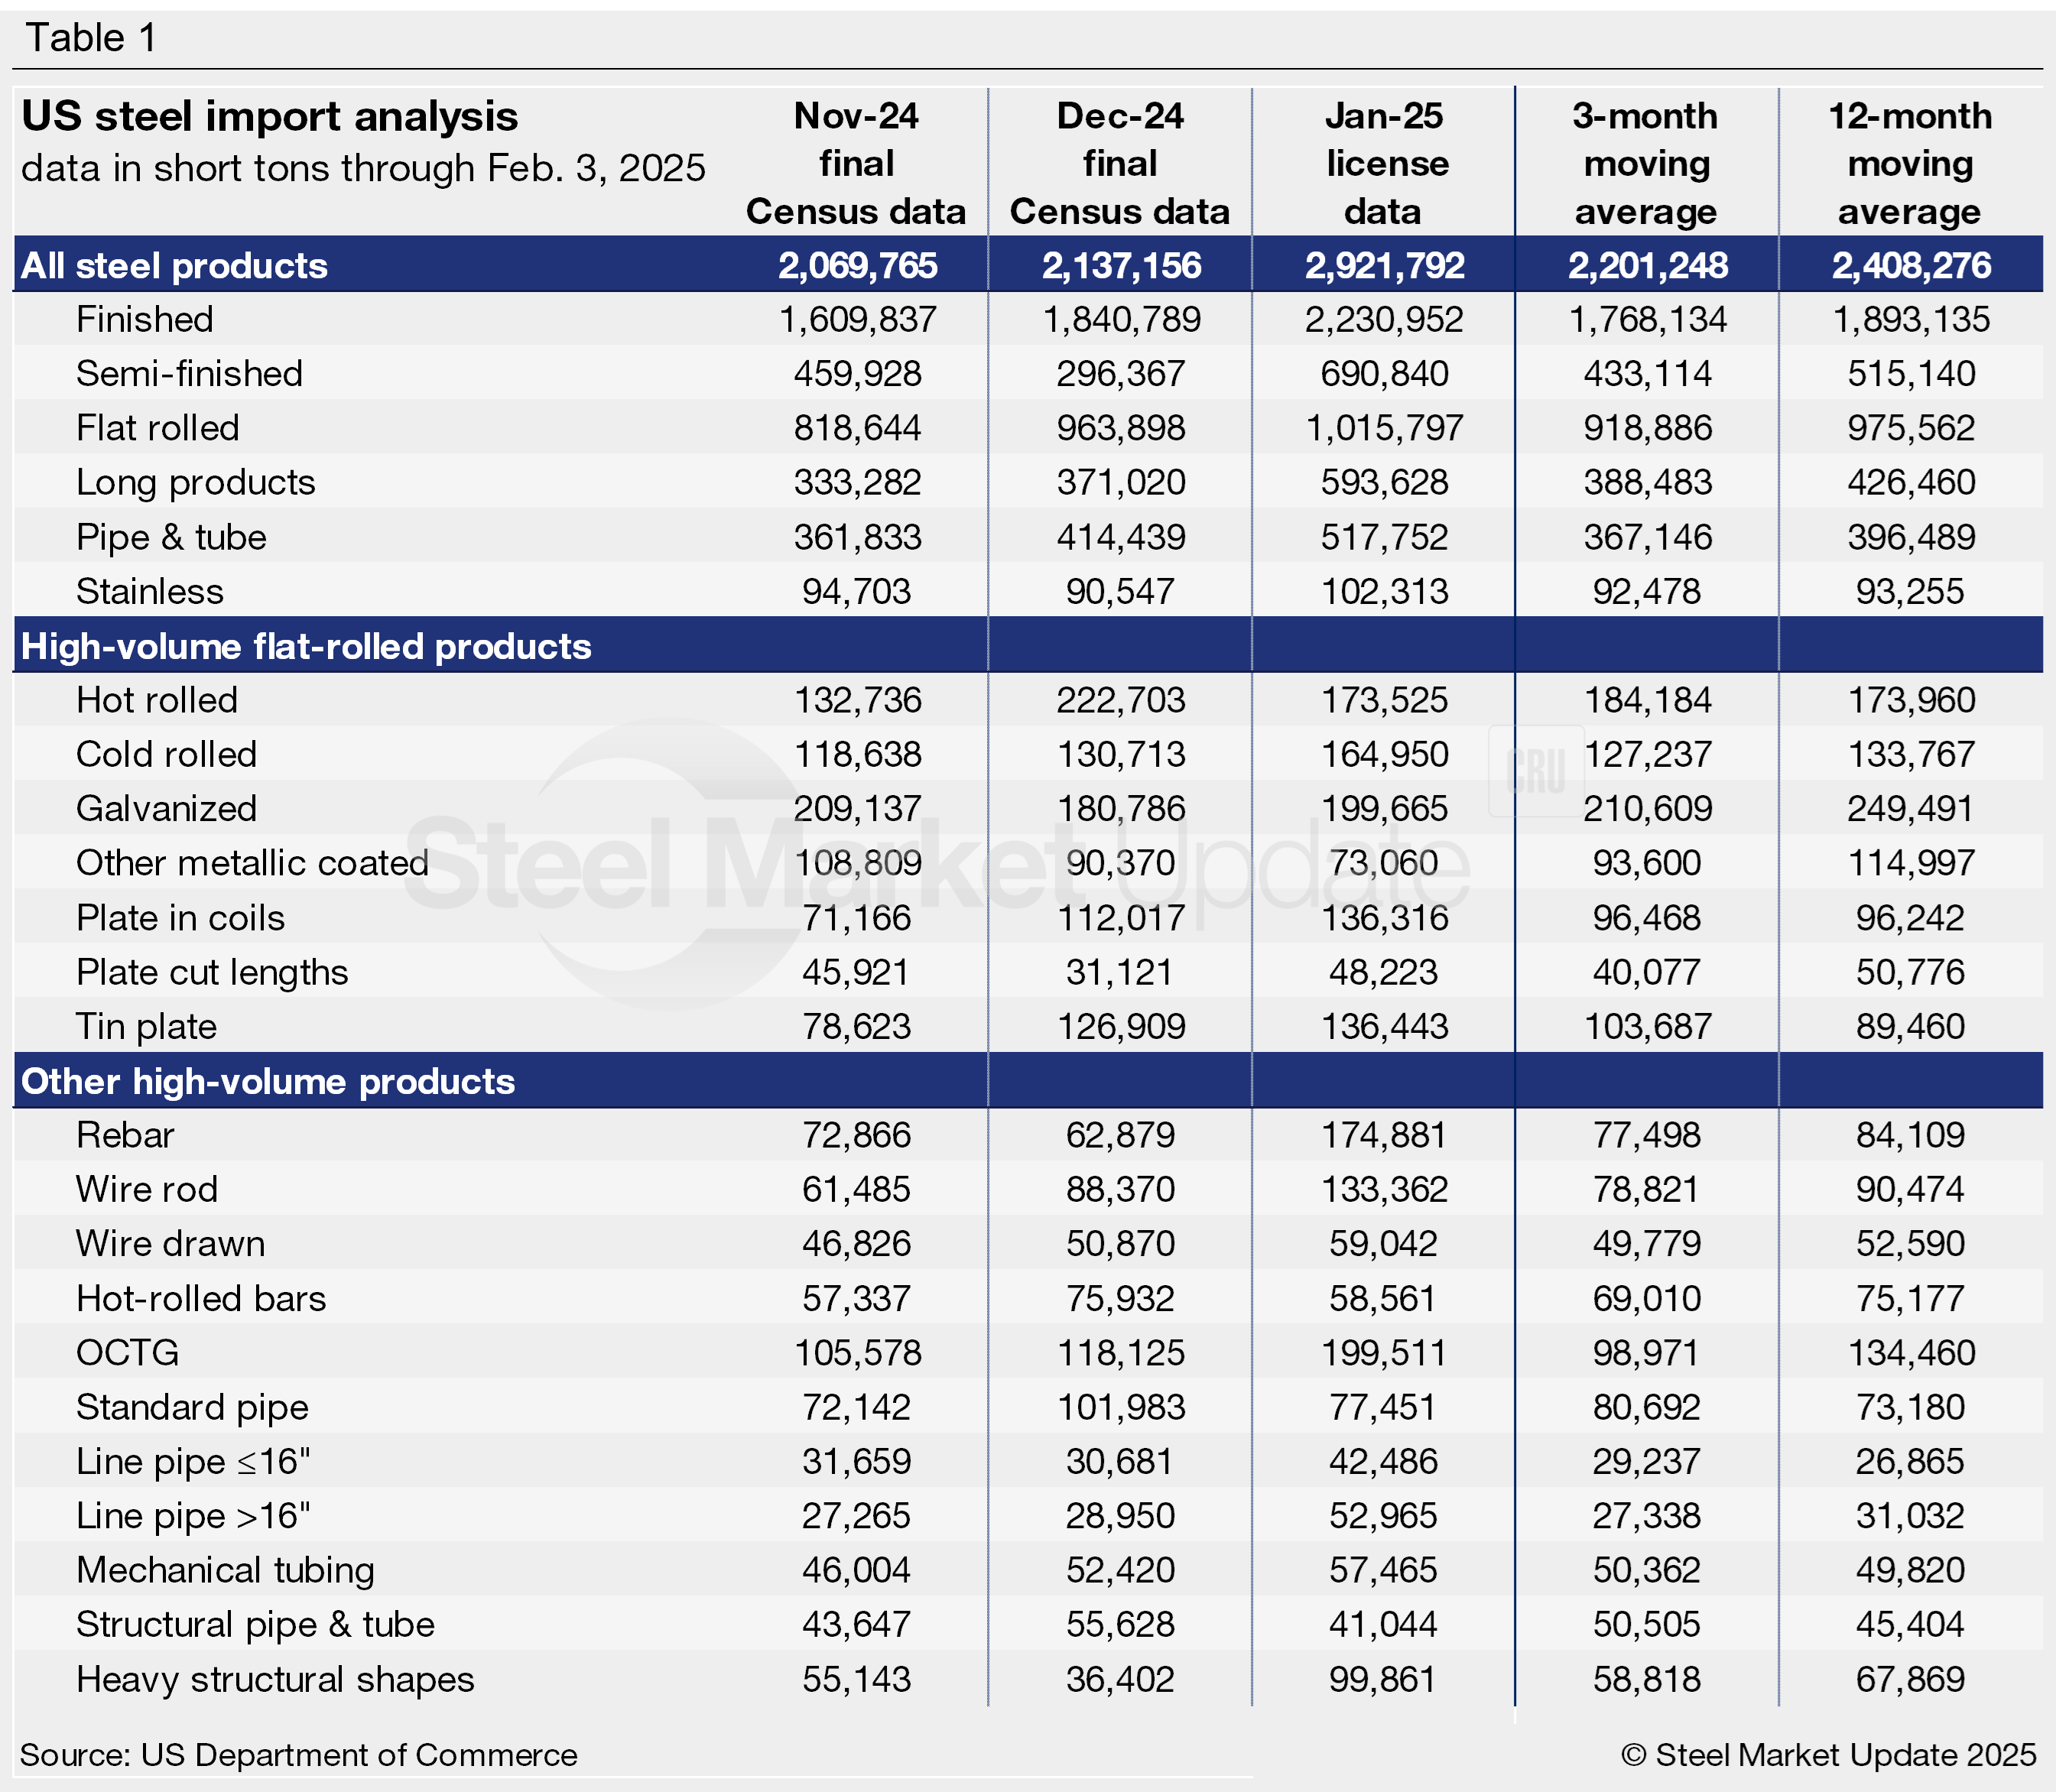
Imports by product
Table 1 provides further detail into imports by product, highlighting high-volume steel products (click to expand). Explore this steel trade data deeper on the Steel Imports page of our website.
To further explore import data in more detail, visit the International Trade Administration’s Steel Import Monitor.