Analysis
January 10, 2025
US steel imports slip to 1-year low in November, rebound in December
Written by Brett Linton
Domestic steel imports fell 14% from October to November to a one-year low of 2.07 million short tons (st), according to final US Commerce Department data. While steel trade has declined from early-2024 highs, November imports are slightly higher than volumes seen one year prior.
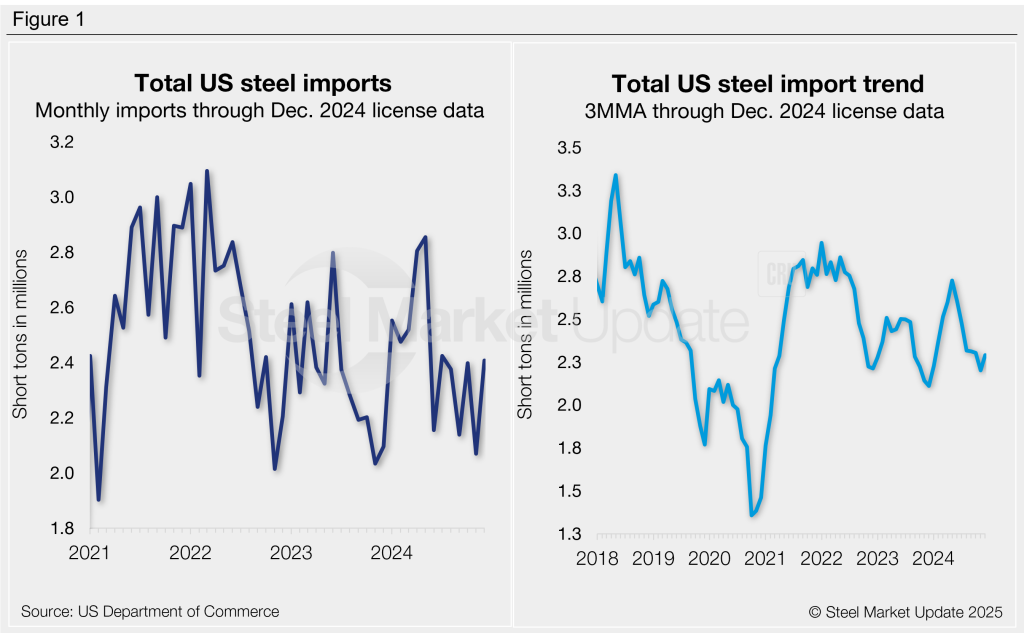
December licenses currently total 2.41 million st, according to license data collected through Jan. 5. This is a potential recovery of 16% month over month (m/m), and would be the highest monthly rate recorded since July (Figure 1, left).
More than half of all of the steel entering the country in November came from just three countries: Canada (23%), Brazil (15%), and Mexico (14%). Other key suppliers included South Korea, Vietnam, Taiwan, Japan, Germany, the United Arab Emirates, and the Netherlands. Together, shipments from these 10 countries accounted for 83% of November imports.
Explore the International Trade Administration’s Steel Import Monitor to view imports by product or country in more detail.
Import trends
To smooth out monthly fluctuations and better highlight long-term trends, we can analyze import data on a three-month moving average (3MMA) basis (Figure 1, right). From this perspective, November imports fell to the lowest level of 2024 at 2.20 million st. The December 3MMA is currently up slightly to 2.29 million st. For comparison, imports averaged 2.35 million st per month in 2023. Through December license data, the 2024 monthly average is slightly higher at 2.43 million st.
Finished vs. semi-finished imports
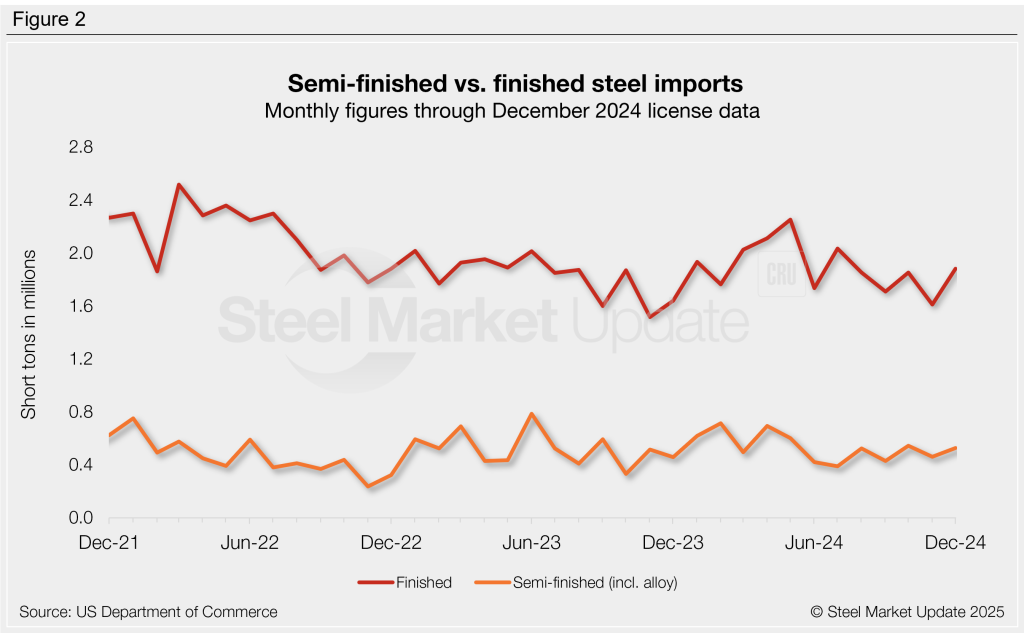
Imports of finished steel products also fell to a one-year low in November, down 13% m/m to 1.61 million st (Figure 2). The latest tally through December shows a potential 17% rebound to 1.88 million st. Finished imports averaged 1.83 million st per month in 2023, while the monthly average 2024 currently stands at 1.90 million st.
Meanwhile, semi-finished steel imports (mostly slabs to be further processed by a mill) fell 15% m/m to 460,000 st November. December licenses currently total 526,000 st, 14% higher than November. Semi-finished imports averaged 524,000 st per month in 2023, whereas January through December 2024 has averaged 534,000 st per month.
Imports by category
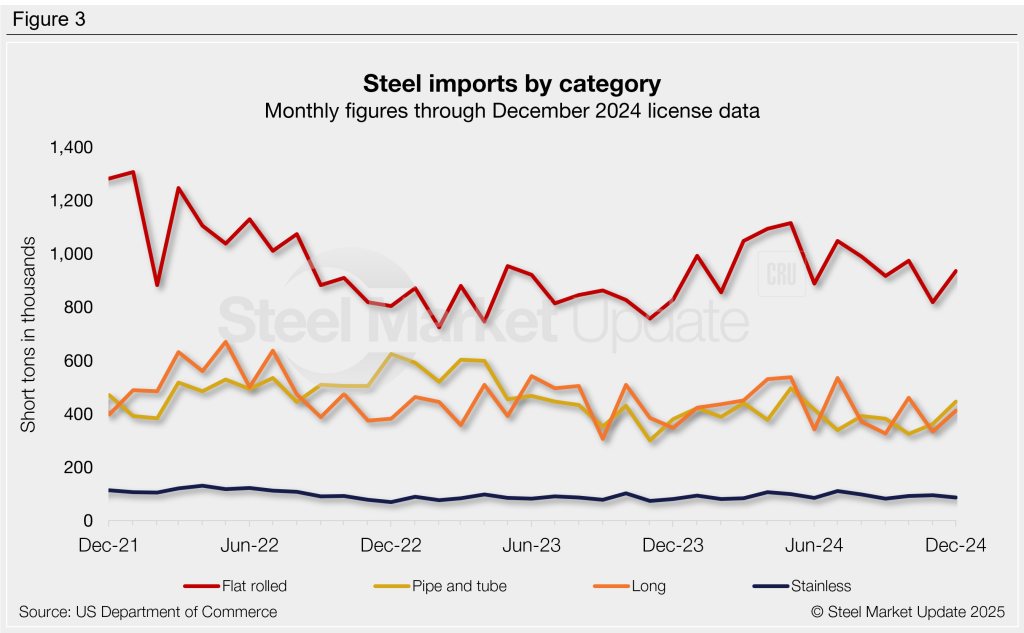
Figure 3 shows monthly imports by popular steel product categories. Noteworthy mentions by category include:
- Imports of flat-rolled products declined 16% m/m in November to the lowest rate seen in a year. The latest December license data shows a potential 14% m/m recovery.
- Imports of long products fell 28% m/m in November, just slightly higher than September’s one-year low. December licenses are currently up 23% from November.
- Pipe and tube imports increased 11% from October’s 11-month low. December licenses are currently up another 23% m/m.
- November stainless imports rose 3% m/m to a three-month high, while December projections are currently down 9% m/m.
Flat-rolled imports
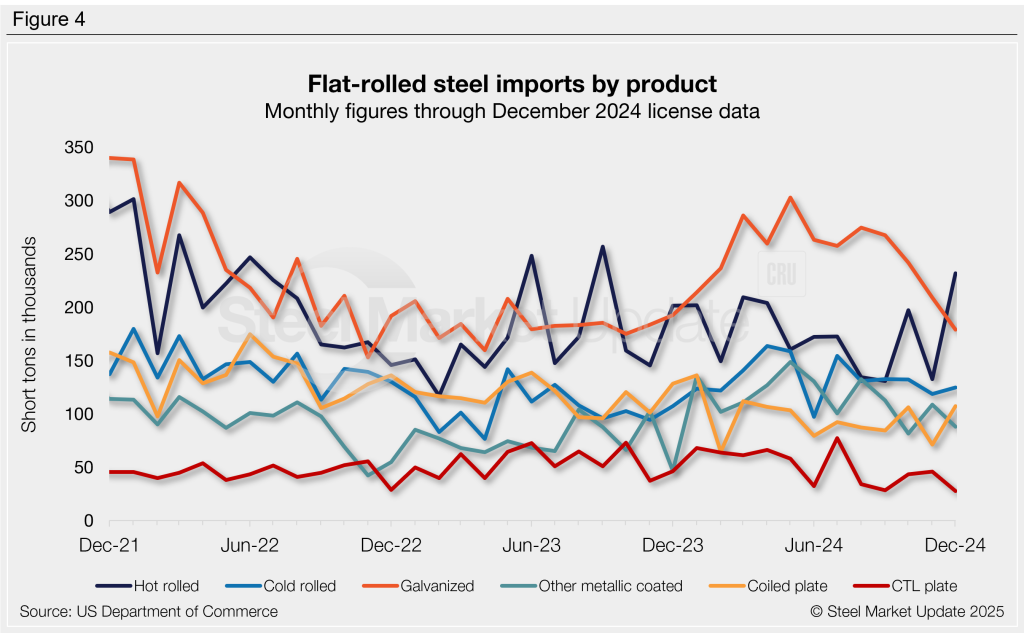
Figure 4 shows flat rolled imports by popular products. Five products saw weakening imports from October to November, while two products increased. December licenses are mixed with some up and some down. Noteworthy mentions by product include:
- Hot-rolled coil imports fell 33% m/m in November to the second-lowest monthly rate recorded in nearly two years. December licenses currently show a sharp 75% m/m rebound, potentially recovering to a 15-month high.
- Cold-rolled coil imports declined 10% m/m in November to a five-month low. The latest license data through December shows a 5% m/m increase.
- Galvanized imports fell 14% m/m in November to an 11-month low. December licenses are currently down another 14%, a potential 14-month low.
- Other-metallic coated imports rebounded 33% in November from October’s 10-month low. December license data shows a 19% m/m decline.
- Coiled plate imports fell 33% m/m to a nine-month low in November. December licenses show a significant recovery, surging 51% m/m to a possible 11-month high.
- Cut-to-length (CTL) plate imports recovered 6% m/m in November, rising to a four-month high. However, December license data currently shows a 40% m/m reduction, potentially the lowest rate seen in almost four years.
- Tin plate imports eased 25% m/m in November to a five-month low. December licenses are back up 46% m/m.
Imports by product
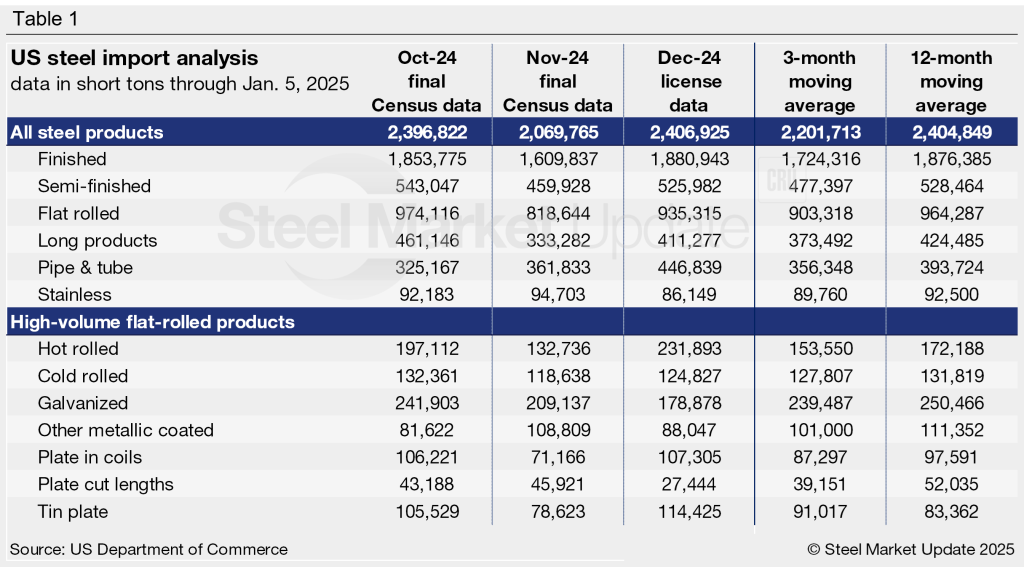
Table 1 provides further detail into imports by product, highlighting high-volume steel products. Explore this steel trade data deeper on the Steel Imports page of our website.