Analysis
March 7, 2025
US steel imports surged in January, reversed in February
Written by Brett Linton
Steel imports ended 2024 on a low note, with November trade falling to a one-year low and December seeing a modest 3% recovery. Then as the new year began, import volumes spiked.
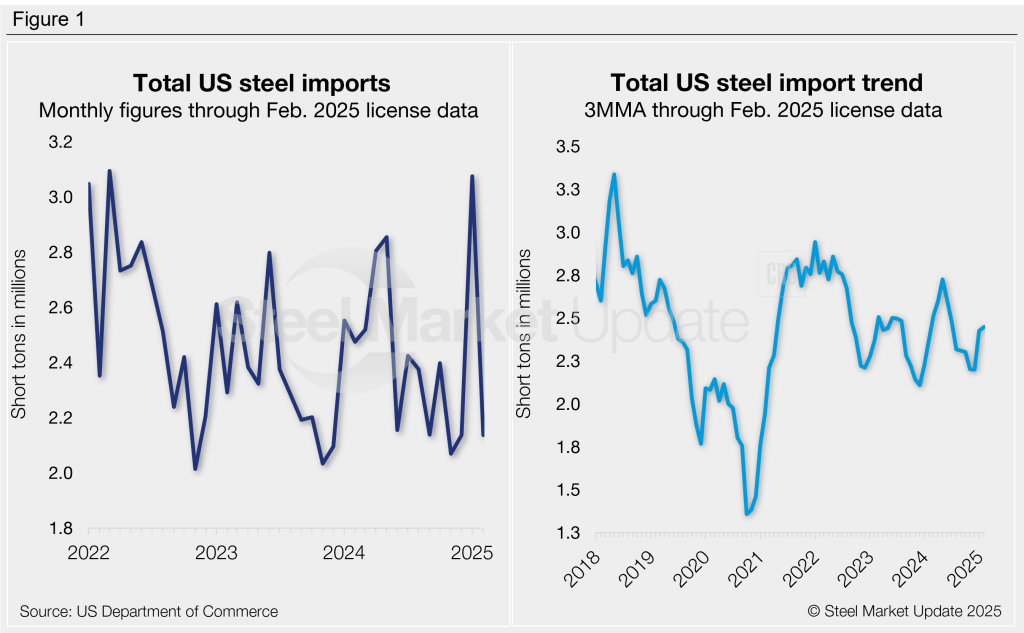
January imports surged 44% month over month (m/m), climbing to a near three-year high of 3.08 million short tons (st) according to census data recently published by the US Commerce Department. However, February licenses indicate that these gains were completely erased, with current estimates at 2.14 million st through March 4 data. This puts import volumes right back around those low levels seen towards the end of 2024 (Figure 1, left).
Nearly two thirds of the steel that entered the country in January was exported from just four countries: Canada (21%), Brazil (19%), and Mexico (15%), and South Korea (11%). Other key suppliers included Japan, Germany, Taiwan, Turkey, China, Vietnam, the Netherlands, and Romania, each supplying 2%-3% of the monthly total. Combined shipments from these 12 countries accounted for 84% of January imports.
To explore import data in more detail, visit the International Trade Administration’s Steel Import Monitor.
Import trends
Import data can be analyzed using a three-month moving average (3MMA) basis to better highlight long-term trends (Figure 1, right). From this perspective, imports increased from a 12-month low in December to a six-month high in January (2.43 million st). The February 3MMA has increased further to 2.45 million st. For comparison, imports averaged 2.41 million st per month in 2024 and 2.35 million st per month in 2023.
Finished vs. semi-finished imports
The jump in January imports was almost evenly split between finished and semi-finished steel products, with volumes rising 486,000 st and 452,000 st m/m, respectively.
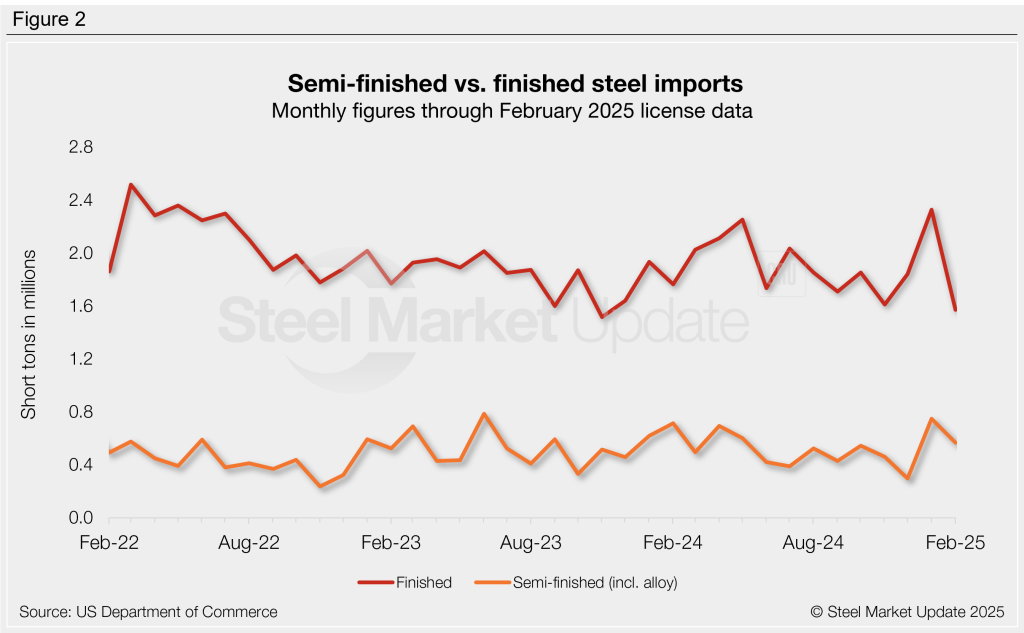
Imports of finished steel products rose 26% m/m to a 32-month high of 2.33 million st (Figure 2). February licenses are currently back down 32% to 1.57 million st. Finished imports averaged 1.89 million st per month in 2024 and 1.83 million st per month in 2023.
Meanwhile, semi-finished steel imports (mostly slabs to be further processed by a mill) rebounded 152% m/m in January to a 19-month high of 748,000 st. (Recall that December semi-finished imports had fallen to a two-year low). February licenses show a 24% m/m decline to 566,000 st. Semi-finished imports averaged 515,000 st per month in 2024 and 524,000 st per month in 2023.
Imports by category
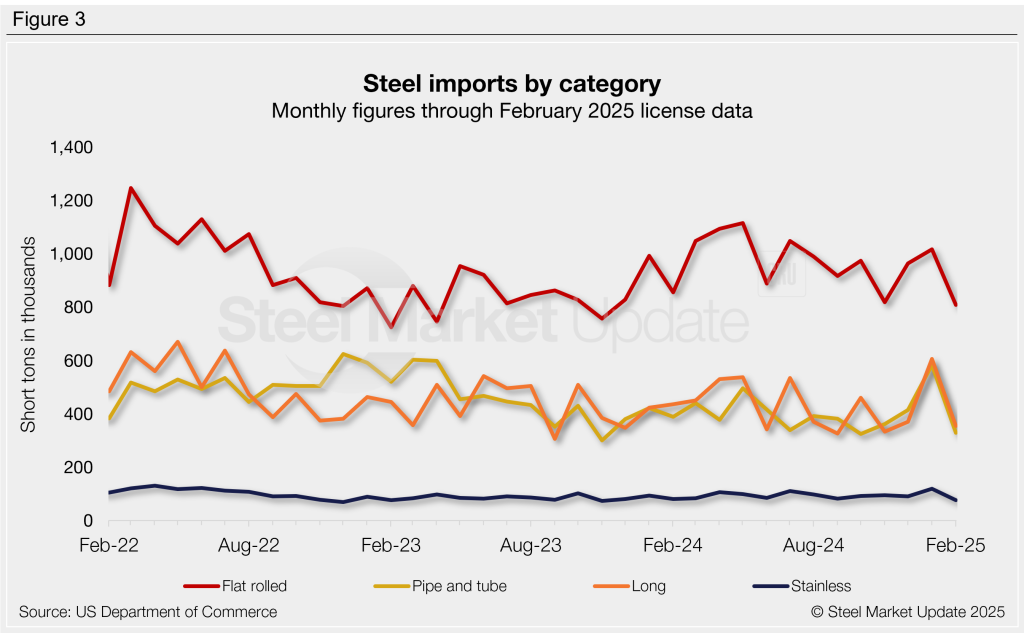
Figure 3 shows monthly imports by popular steel product categories. Noteworthy mentions by category include:
- Flat-rolled imports increased just 5% from December to January (rising 53,000 st). February licenses currently show a potential 20% m/m decline.
- Imports of long products jumped 63% m/m in January to a two-and-a-half-year high. This category saw the largest monthly gain (235,000 st higher than December). February licenses are currently down 42% from January.
- Pipe and tube imports increased 41% m/m in January (rising 169,000 st m/m), the highest rate seen in 21 months. January’s gain will potentially be erased in February, as licenses are currently down 44% m/m.
- January stainless imports increased 31% m/m to a six-month high, rising 28,000 st from December. February projections are currently down 36% m/m.
Flat-rolled imports
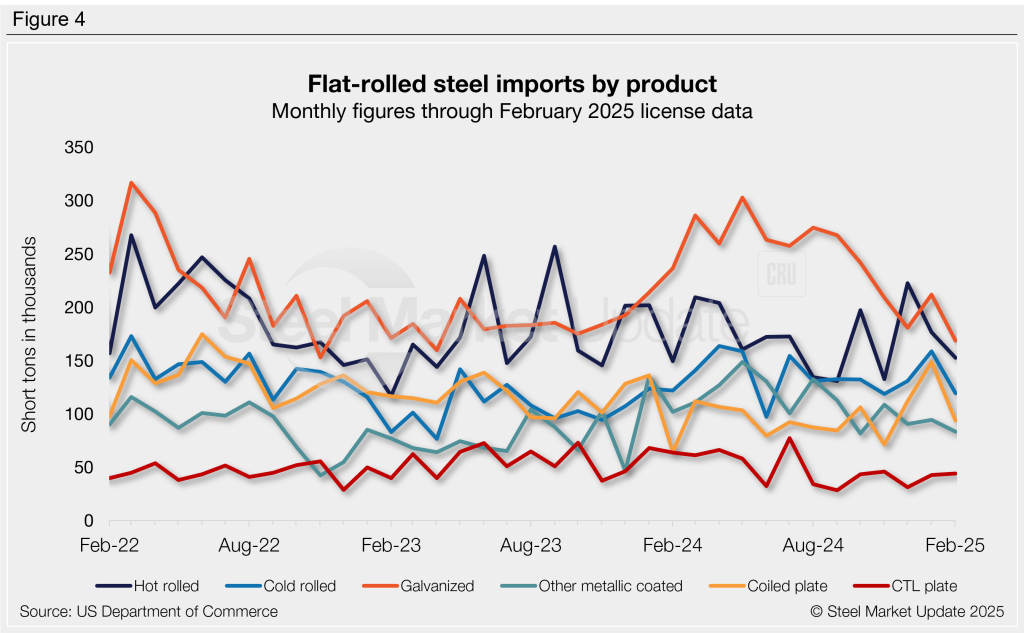
Figure 4 shows flat rolled imports by popular products. Five of the seven select products saw increasing imports from December to January, rates for two products declined. February licenses are down for all products other than cut-to-length plate. Noteworthy mentions by product include:
- Hot-rolled coil imports fell 21% m/m in January following December’s 15-month high. February levels are potentially down another 14%.
- Cold-rolled coil imports rebounded 21% m/m in January to a eight-month high. License data through February shows a 25% m/m decline.
- Galvanized imports increased 17% m/m in January, while February licenses are back down 20% to a potential 22-month low.
- Other-metallic coated imports rose 4% m/m in January. February licenses are down 12%.
- Coiled plate imports jumped 33% m/m in January to a two-and-a-half-year high. February licenses are back down 37%.
- Cut-to-length (CTL) plate imports recovered 37% m/m in January. February licenses are up another 3%.
- Tin plate imports fell 12% m/m in January, and February licenses are down another 21% m/m.
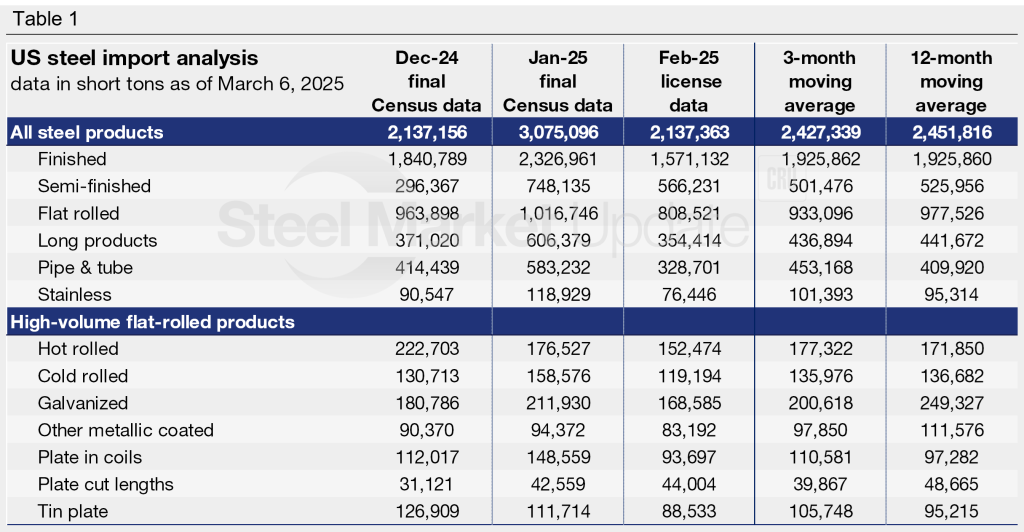
Imports by product
Table 1 provides further detail into imports by product, highlighting high-volume steel products (click to expand). Explore this steel trade data deeper on the Steel Imports page of our website.