Market Data

December 10, 2024
US steel imports ticked higher in October, reversed course in November
Written by Brett Linton
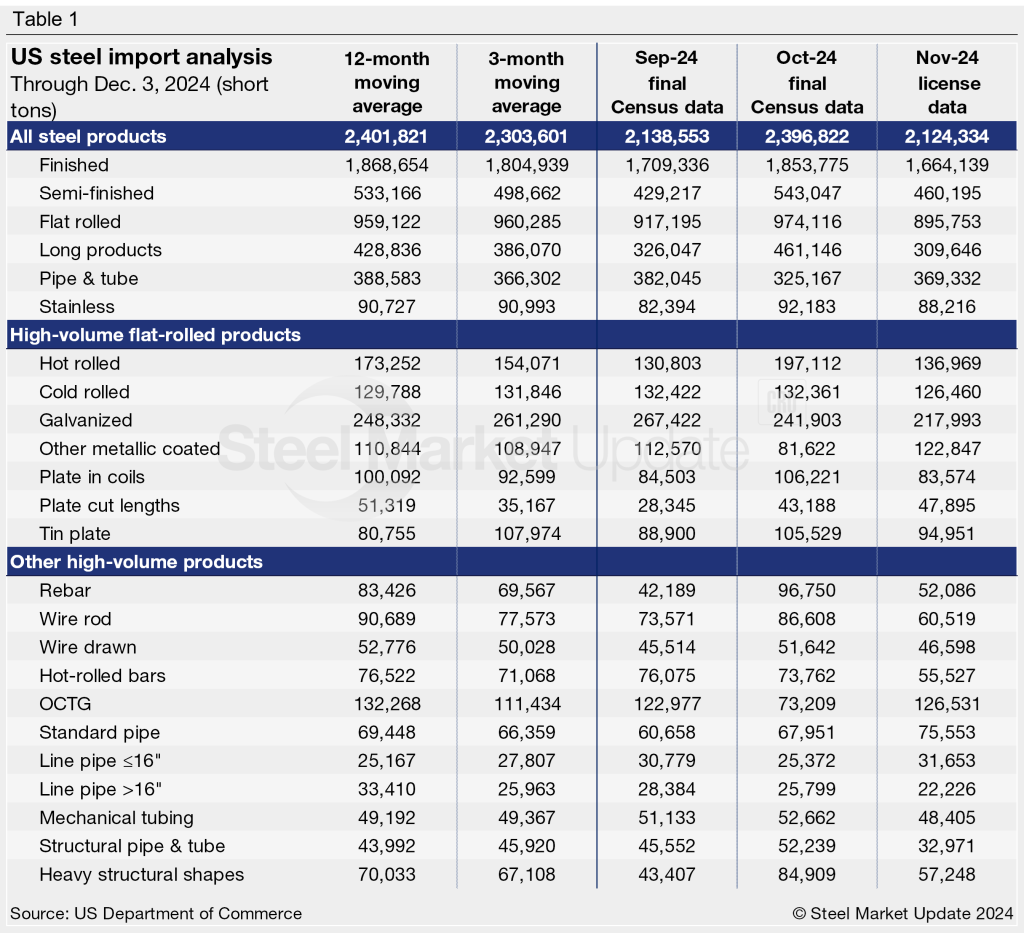
The total amount of steel imported into the US rebounded to 2.40 million short tons (st) in October, according to recently released US Commerce Department data, Monthly imports have remained within a relatively narrow range since June, significantly lower than volumes seen earlier this year, but stronger than late-2023 levels.
October imports were 12% greater than September’s nine-month low of 2.14 million st. According to license data collected through Dec. 3, November licenses currently total 2.12 million st, down 11% month over month (m/m) and a potential 11-month low (Figure 1, left).
More than half of all of the steel entering the country in October came from just three countries: Canada (23%), Brazil (15%), and Mexico (15%). Other significant contributors include South Korea, Germany, Japan, Vietnam, the Netherlands, Taiwan, and Spain. Together, these 10 countries accounted for 83% of all imports in October.
Explore the International Trade Administration’s Steel Import Monitor to view imports by product or country in more detail.
Smoothing out the data
To smooth out monthly variations, we can look at imports on a three-month moving average (3MMA) basis to highlight trends more clearly (Figure 1, right). From this perspective, final October imports fell to a nine-month low of 2.30 million st. Recall that back in May we saw the 3MMA near a two-year high of 2.73 million st. The 3MMA through November is currently down further to 2.22 million st.
For comparison, the average monthly import rate of 2023 was 2.35 million st, while the first 11 months of 2024 have averaged 2.44 million st.
Semi-finished vs. finished imports
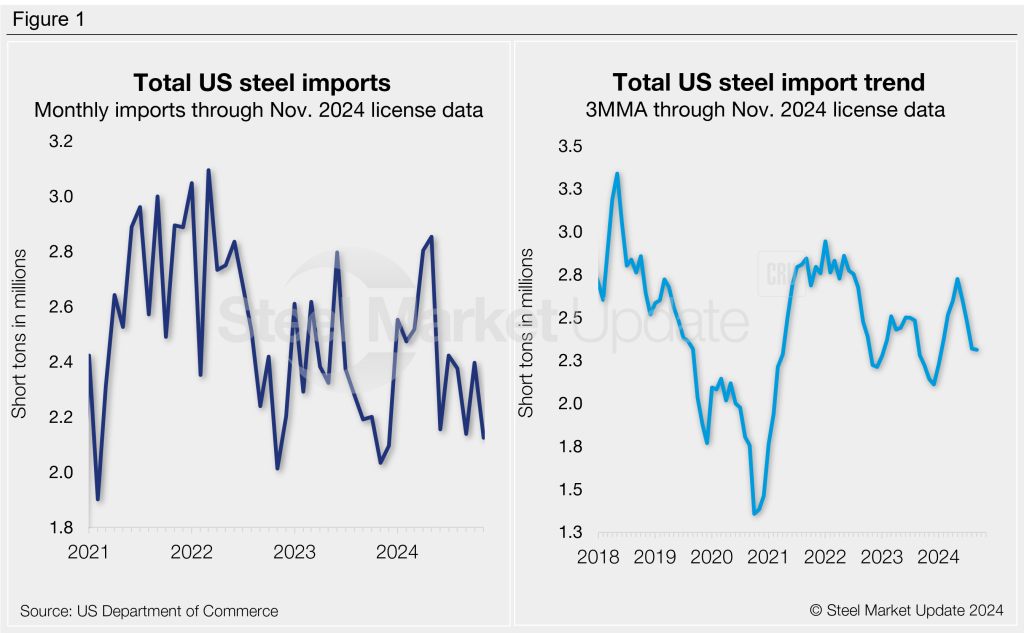
Imports of finished steel products rose to a three-month high of 1.85 million st in October, 8% higher than September’s nine-month low. The latest finished import tally through November is down 10% to 1.66 million st, the lowest monthly rate seen so far this year. For reference, finished imports had averaged 1.83 million st per month last year. The monthly average for the first 11 months of 2024 now stands at 1.90 million st.
Meanwhile, semi-finished steel imports (mostly slabs to be further processed at a mill) jumped 27% m/m to a five-month high of 543,000 st October (Figure 2). November licenses currently total 460,000 st, 15% lower than October. Semi-finished imports averaged 524,000 st per month last year, whereas January through November 2024 has averaged 535,000 st per month.
Imports by category
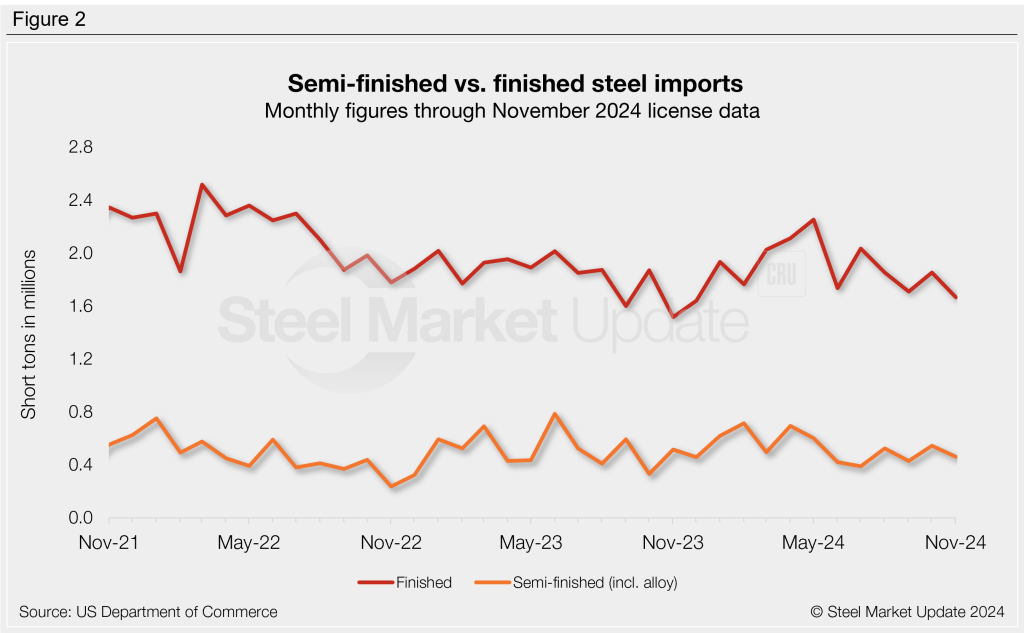
Figure 3 shows monthly imports by product category. Noteworthy mentions by category include:
- Imports of flat-rolled products rebounded 6% m/m in October to 974,000 st. The latest license data shows a potential 8% decline in November to 896,000 st, the lowest rate seen since June.
- Imports of long products surged 41% in October to a three-month high of 461,000 st. This comes after September’s one-year low rate of 326,000 st. November licenses are currently down 33% from October at 310,000 st, a potential 14-month low.
- Pipe and tube imports eased 15% m/m in October to an 11-month low of 325,000 st. November licenses are currently up 14% to 369,000 st.
- October stainless imports rose 12% from September’s seven-month low to 92,000 st. November projections are currently at 88,000 st, potentially down 7% m/m.
Flat-rolled imports
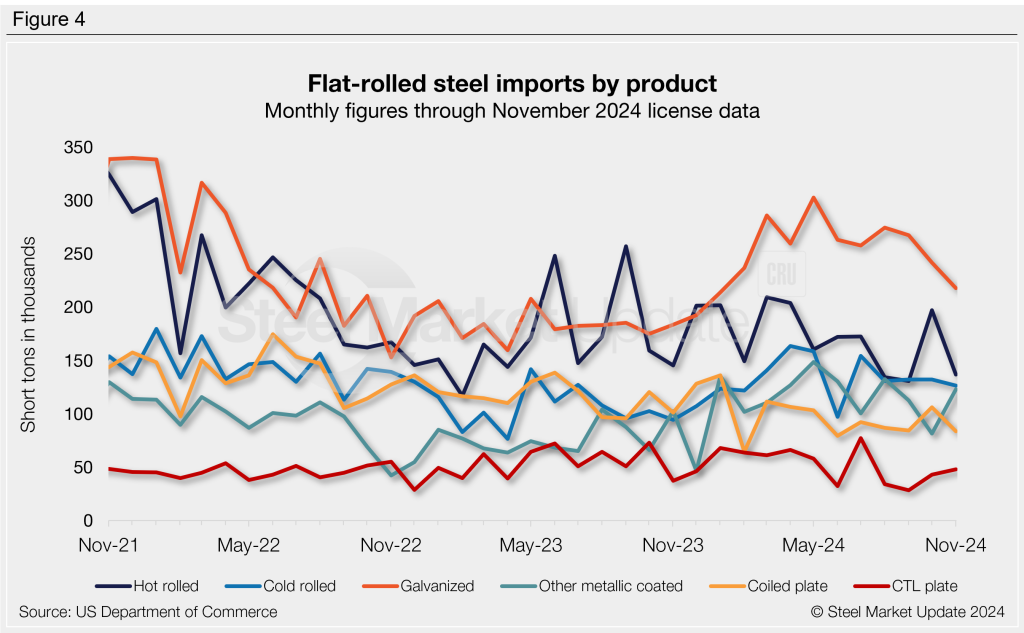
Figure 4 shows flat rolled imports by popular products. Four products saw strengthening imports from September to October, while three products declined. November licenses are down for most of the flat-rolled products we track. Noteworthy mentions include:
- Hot-rolled coil imports jumped to a six-month high in October, but licenses receded in November to a near a multi-year low.
- Cold-rolled coil imports have been fairly flat since August, in line with average 2024 levels and higher than those seen this time last year.
- Galvanized coil imports have trended downwards since peaking in May, falling to a 10-month low in November.
- Other-metallic coated imports fell to the lowest level of the year in October, but November licenses show a strong rebound.
- Plate cut length imports had bottomed out in August and September to multi-year lows, but are showing improvements through October and November.
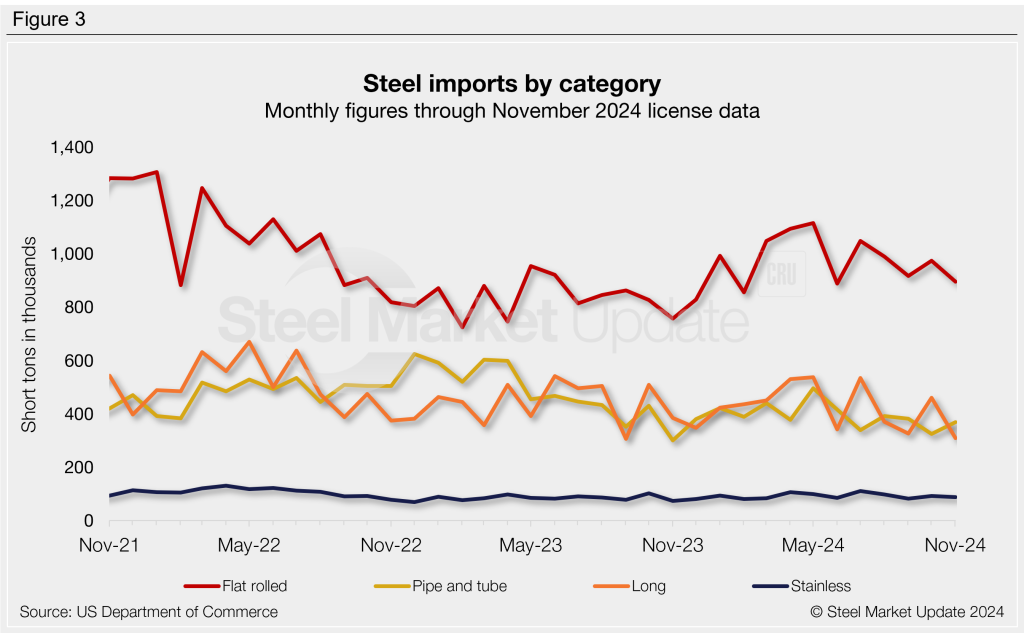
Imports by product
Table 1 provides further detail into imports by product, highlighting high-volume steel products. Explore this steel trade data deeper on the Steel Imports page of our website.