Market Data
March 8, 2024
February import licenses slip from January’s seven-month high
Written by Brett Linton
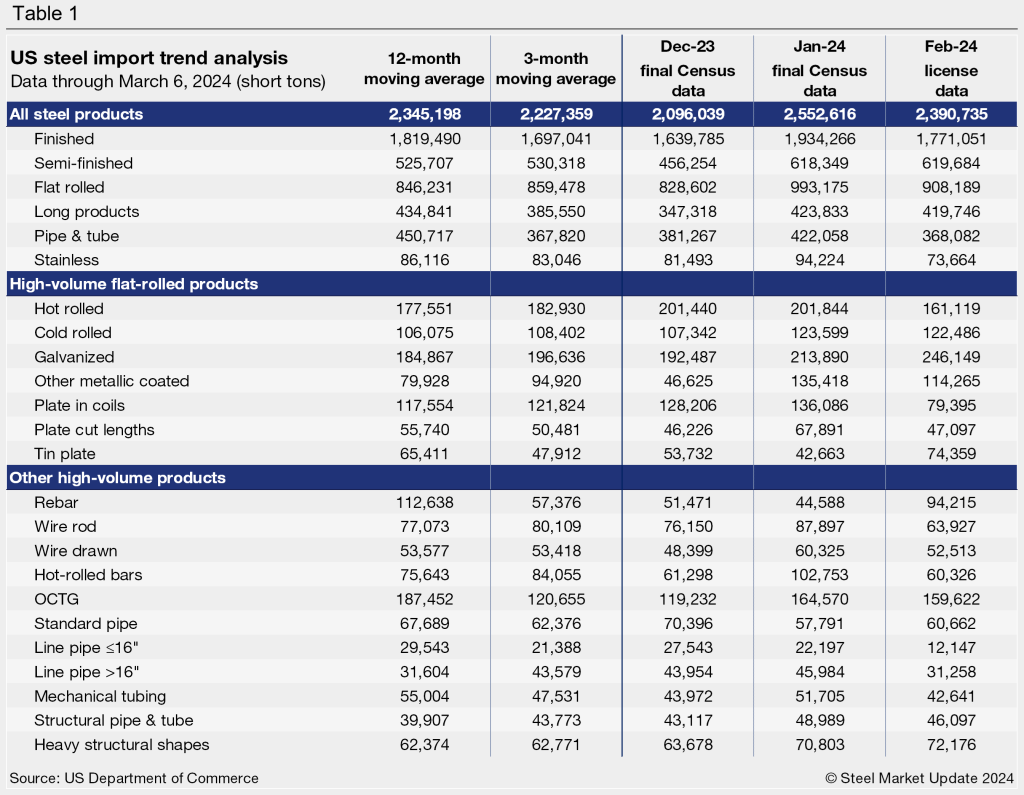
The latest steel import license data from the US Commerce Department shows 2.39 million short tons (st) of steel entered the country in February 2024, down 6% from the month prior. This is the second-highest monthly rate recorded over the last seven months, with January holding the number one spot with 2.55 million st imported (Figure 1).
Imports as a 3MMA
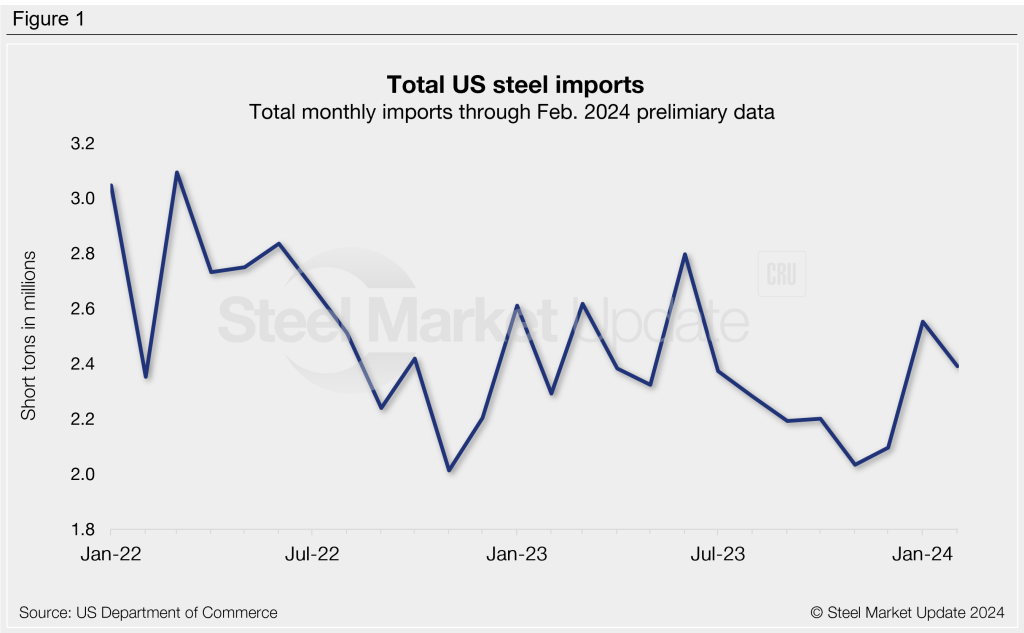
Looking at imports on a three-month moving average (3MMA) basis can smooth out the variability in monthly readings. As shown in Figure 2, imports slowed in the second half of 2023 but have begun to recover this year. The 3MMA through final January figures is 2.23 million st, but jumped to 2.35 million st through February license data.
Semi-finished vs finished steel
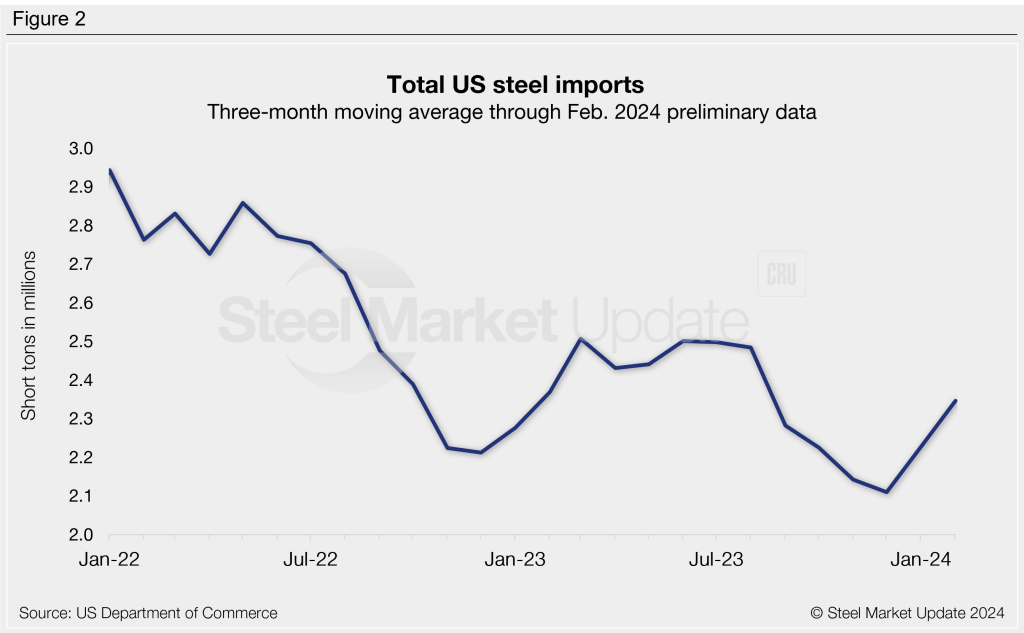
Imports of semi-finished steel had surged 36% from December to January to 618,349 st. Semi-finished licenses remained relatively unchanged in February, just 1,300 tons higher. On the other hand, finished steel imports declined 8% from the January high, now totaling 1.77 million st.
The American Iron and Steel Institute (AISI) estimates finished steel imports accounted for 21% of the total US steel market share in February, down from a rate of 22% in January.
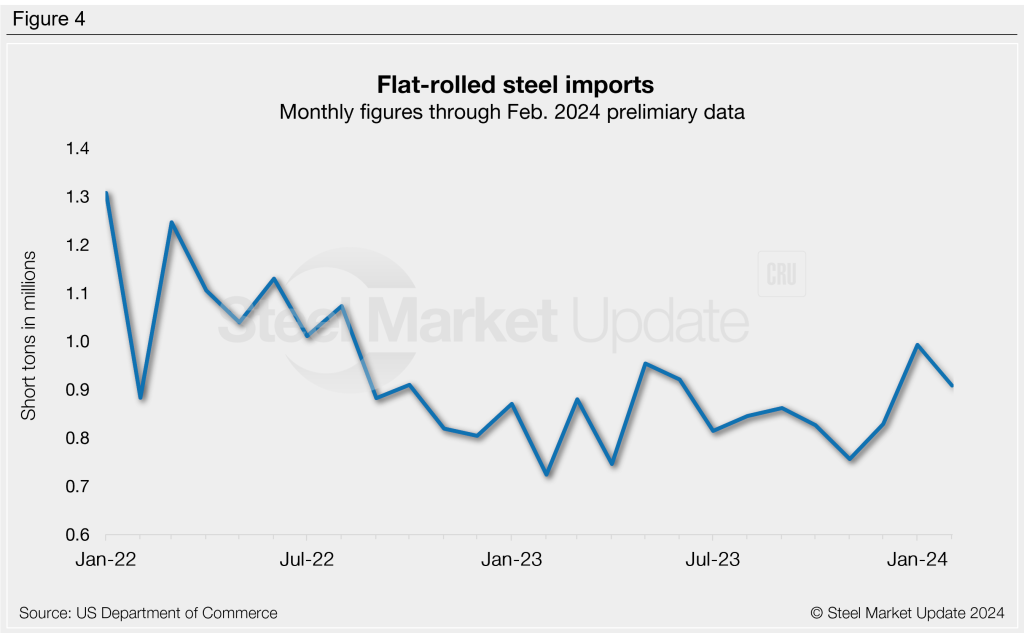
Flat-rolled steel
Having reached a 17-month high in January, total flat-rolled steel imports eased in February to 908,189 tons. The biggest movers were plate products, with tin plate up 74% month over month (m/m), coiled plate down 42%, and plate cut lengths down 31%. Other notable mentions were hot-rolled coil down 20% m/m, other metallic coated products down 16%, and hot-dipped galvanized imports up 15%.
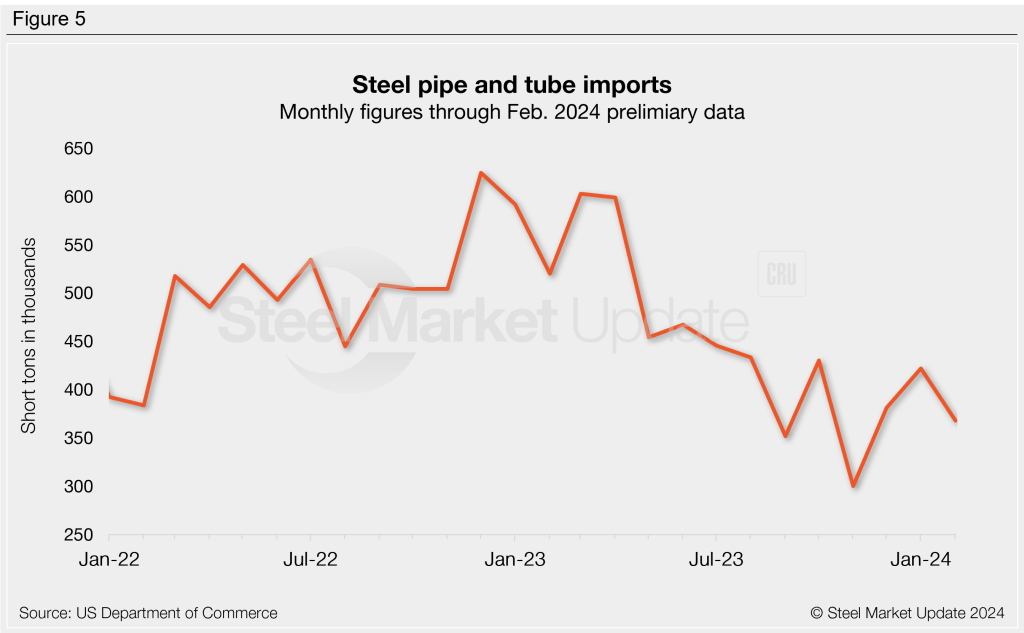
Pipe & tube
Pipe and tube imports slipped 13% from January to February, now at 368,082 st. After hitting a three-year low of 78,163 st in November, OCTG imports had rebounded through January.
Imports by product
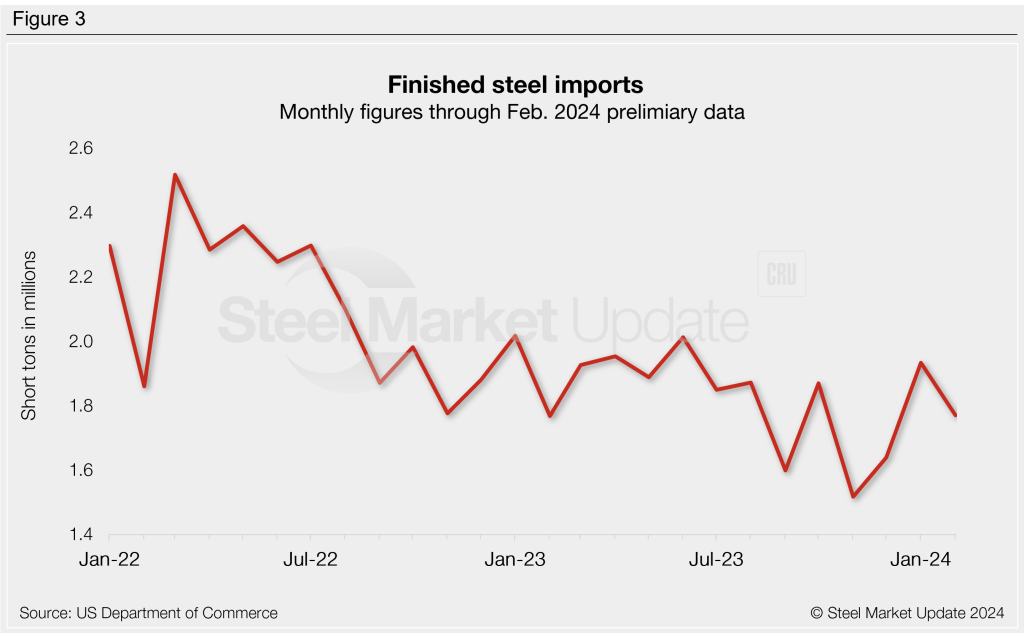
The chart below provides further detail into imports by product, highlighting high-volume steel products. Significant shipment changes were seen in rebar (up 111% m/m), line pipe (down 32-45%), hot rolled bars (down 41%), wire rod (down 27%), and mechanical tubing (down 18%).