

Market Data
April 11, 2025
Apparent steel supply contracts in February
Written by Brett Linton
The amount of finished steel that entered the US market in February receded from January’s peak, according to our analysis of US Department of Commerce and American Iron and Steel Institute (AISI) data.
Referred to as apparent steel supply, we calculate this volume by adding domestic steel mill shipments to finished US steel imports and subtracting total US steel exports.
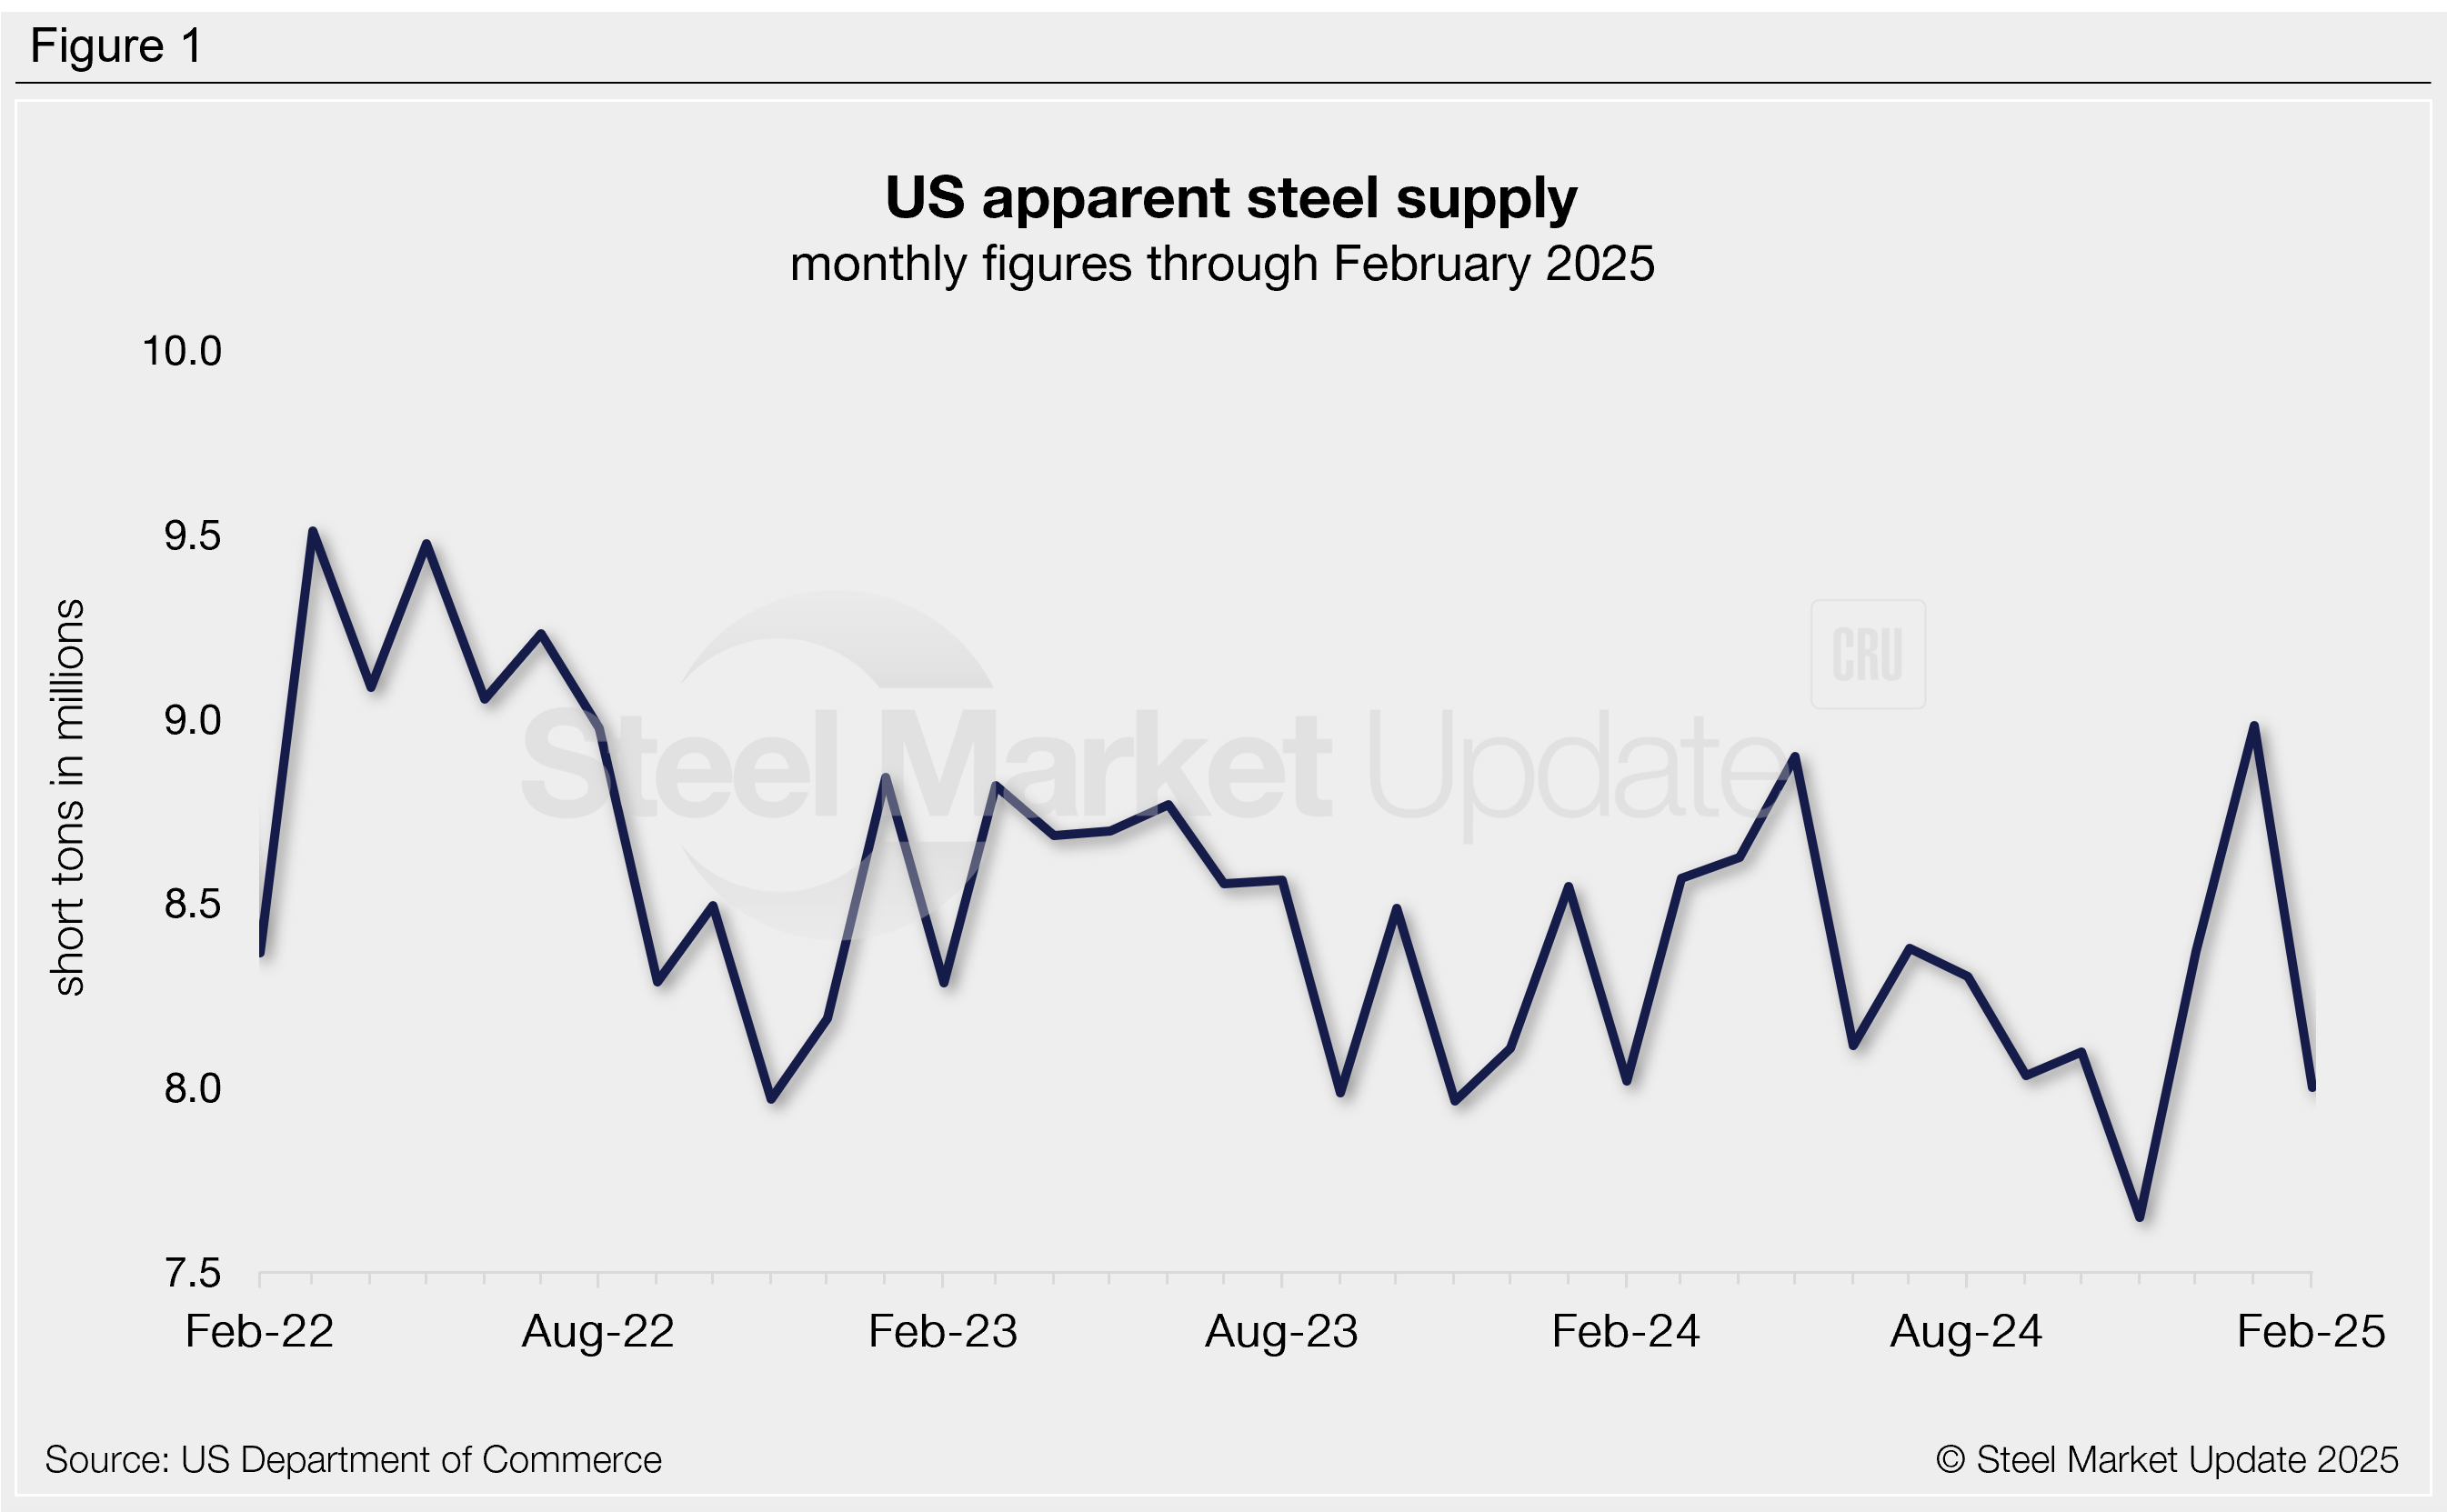
Apparent supply declined to 8.00 million short tons (st) in February, a month-over-month (m/m) decrease of 979,000 st, or 11%. While down, February supply is just 16,000 tons shy of the same month last year.
Supply has fluctuated within a stable range over the past two and a half years, averaging 8.38 million st per month in that time (Figure 1). We have seen increased volatility across the last few months.
In November, we saw supply fall to a near four-year low of 7.65 million st, then it rebounded in January to a two-and-a-half year high of 8.98 million st.
For context, the highest monthly supply rate in our 15-year data history was 10.90 million st in October 2014, while the lowest was 6.52 million st in April 2020.
Trends
To better highlight underlying trends and smooth out monthly fluctuations, supply can be calculated on a three-month moving average (3MMA), as shown in Figure 2.
On this basis, supply has overall trended lower since the late-2021 peak (9.87 million st). The 3MMA increased in February for the third consecutive month to 8.45 million st, now up to a seven-month high.
This comes just months after the near-four-year low 3MMA of 7.93 million st seen in November. One year ago, the 3MMA was 8.23 million st, and two years ago it was 8.44 million st.
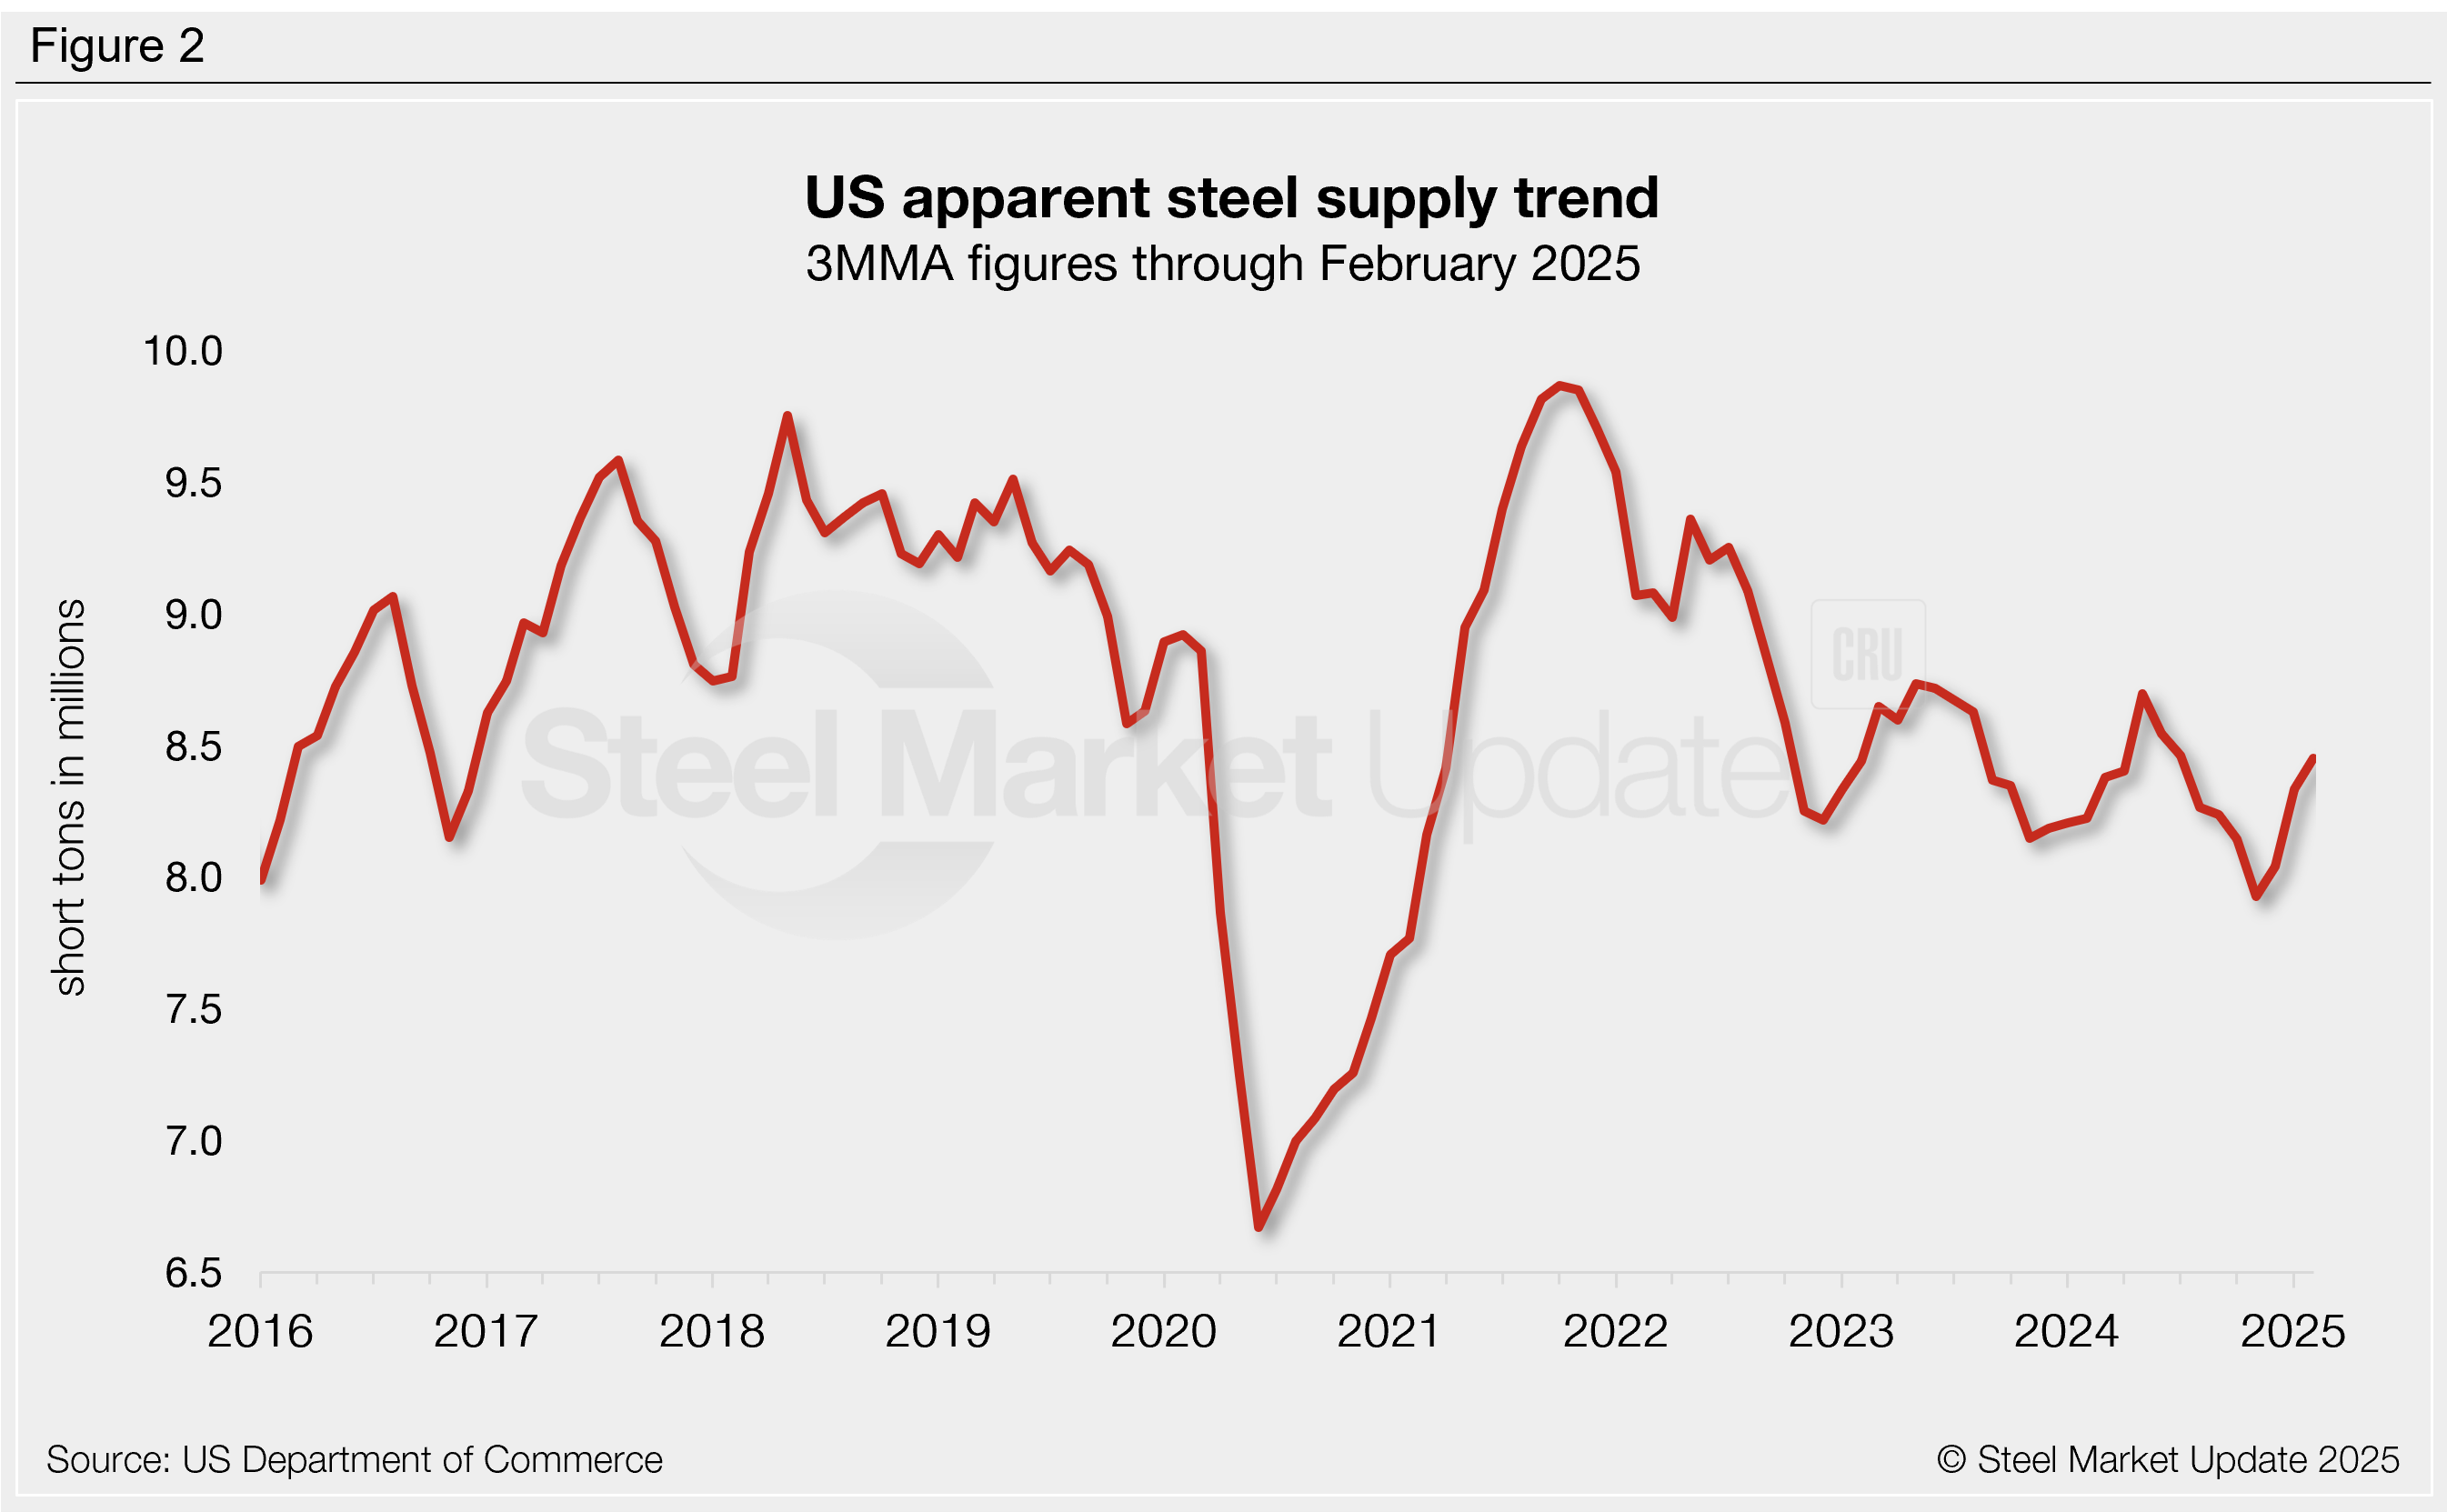
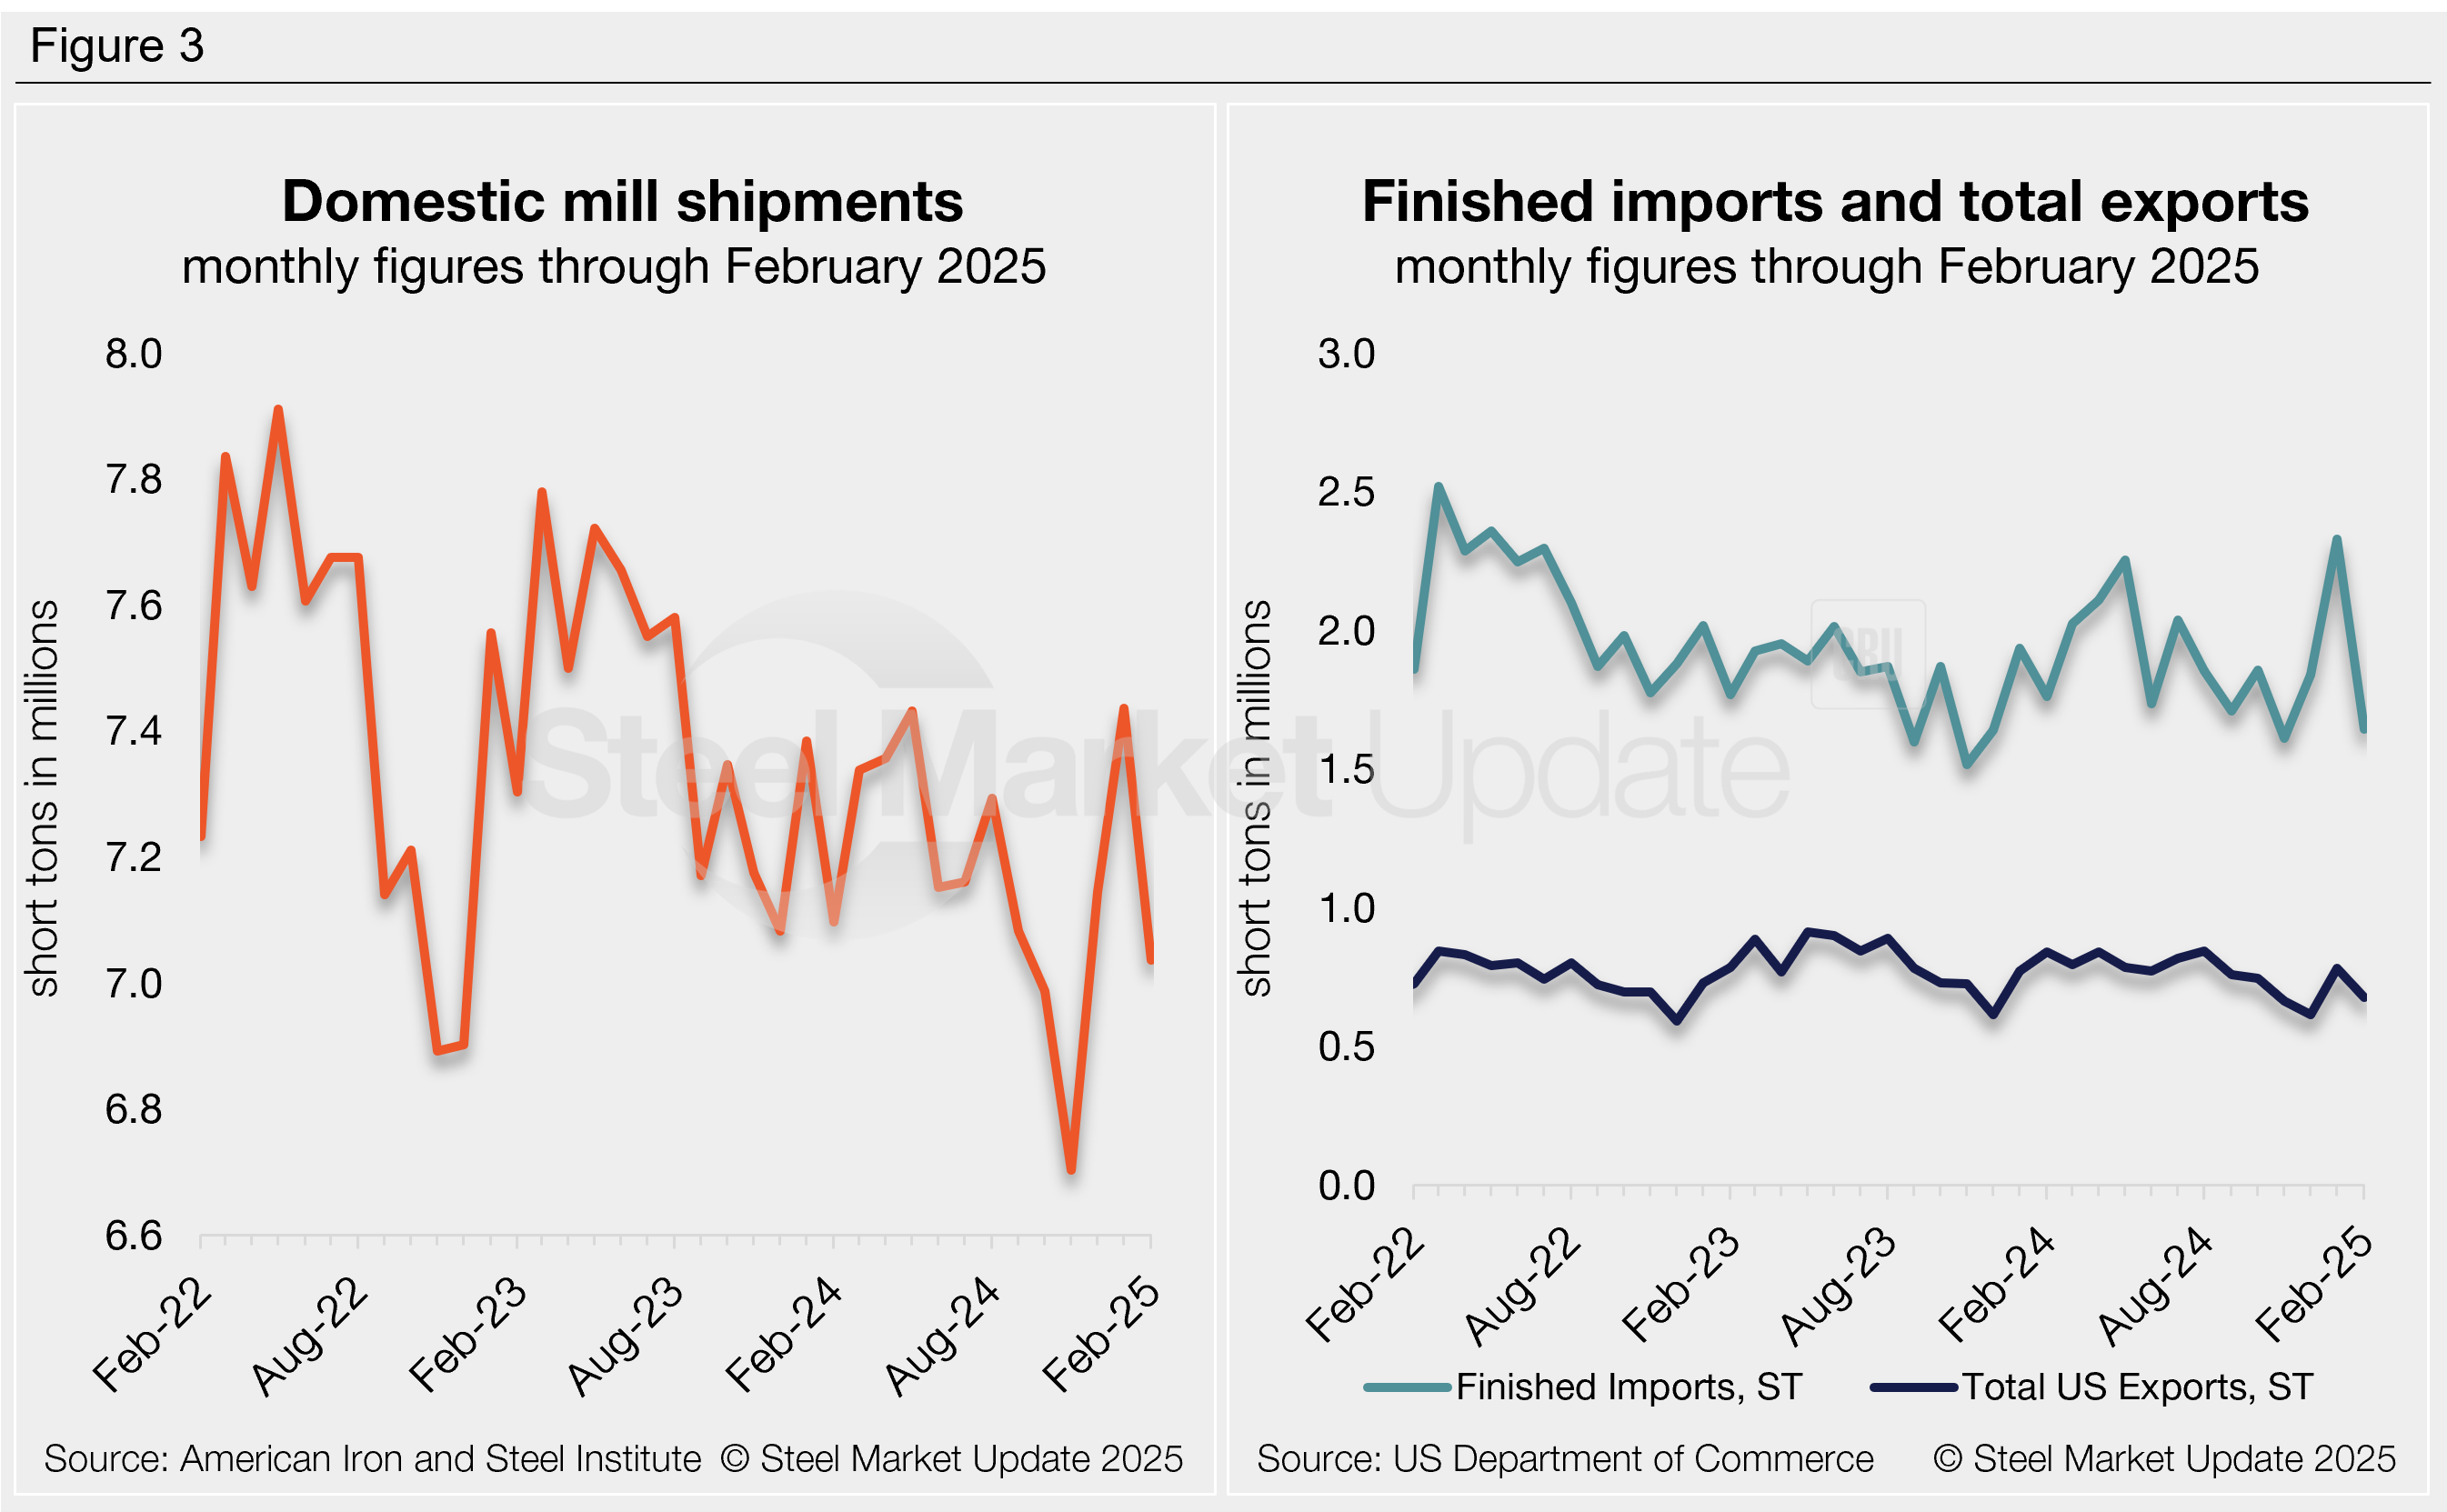
Figure 3 graphs the individual inputs for apparent supply, clearly showing how finished steel imports primarily contributed to February’s increased volume.
– Previously at a 17-month high, domestic mill shipments declined 5%, or 104,000 st, in February, making up the majority of supply (88%).
– Finished steel imports slipped 29%, or 683,000 st, m/m in February, previously at a 32-month high. This was the largest factor contributing to February’s supply reduction.
– February exports edged lower from January’s five-month high, down 13%. or 400,000, st m/m. This reduction somewhat offset the overall decline in supply.
– Net imports accounted for 12% of February’s supply.
To see an interactive graphic of our apparent steel supply history, click here. If you need any assistance logging into or navigating the website, contact us at info@steelmarketupdate.com.


