Market Data

October 17, 2024
Apparent steel supply eases in August
Written by Brett Linton
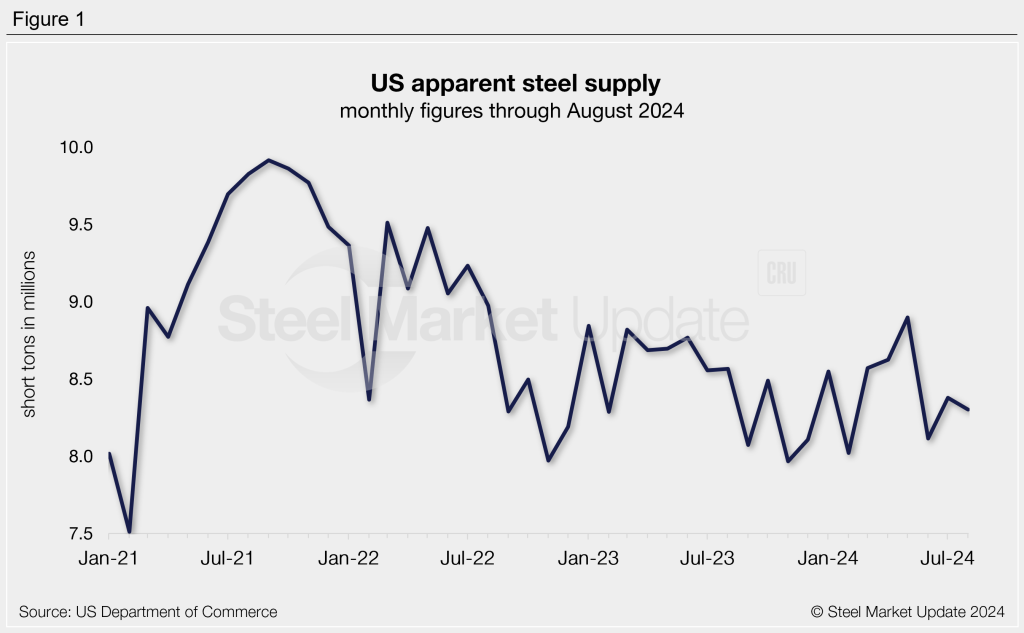
The volume of finished steel entering the US market declined in August from July, according to SMU’s analysis of data from the US Department of Commerce and the American Iron and Steel Institute (AISI). Referred to as ‘apparent steel supply,’ we calculate this monthly rate by combining domestic steel mill shipments and finished US steel imports and deducting total US steel exports.
Apparent supply registered 8.30 million short tons (st) in August. Supply declined by 1%, or 76,000 st, from the month prior and is 2% below the average monthly rate of 2024 (8.43 million st). Recall that earlier this year supply reached a 21-month high in May at 8.90 million st. This time last year apparent supply totaled 8.56 million st.
Trends
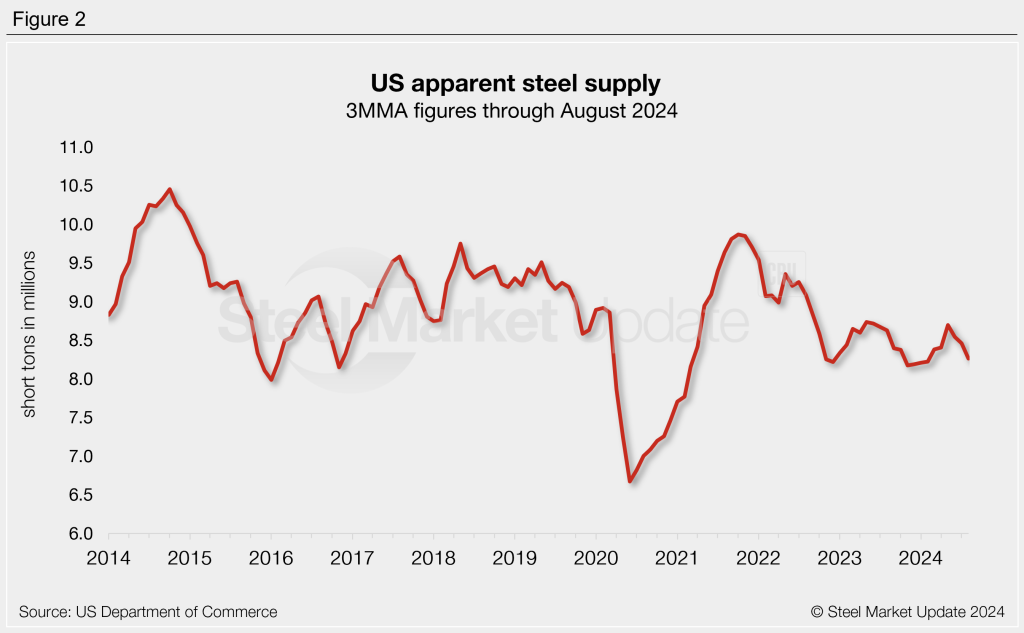
To smooth out the variability seen month to month, we can calculate supply levels on a three-month moving average (3MMA) basis to better show long-term trends. As shown in Figure 2, supply on a 3MMA basis has generally trended downward over the past three years, following the late 2021 peak of 9.87 million st. The 3MMA has eased each of the past three months, following May’s 11-month high of 8.70 million st. The August 3MMA is now down to a six-month low of 8.46 million st. Compare this to the 2023 monthly supply average of 8.49 million st and the 2022 average of 8.83 million st.
Looking across the last four months, August apparent supply is on the lower side of recent rates. Over this period we have witnessed a recovery in domestic mill shipments, fluctuating finished imports, and strengthening exports. The decline from July to August was primarily due to a 183,000-st (9%) decline in finished imports and a 24,000-st (3%) increase in exports, more than half of which was negated by a 132,000-st (2%) rise in domestic shipments.
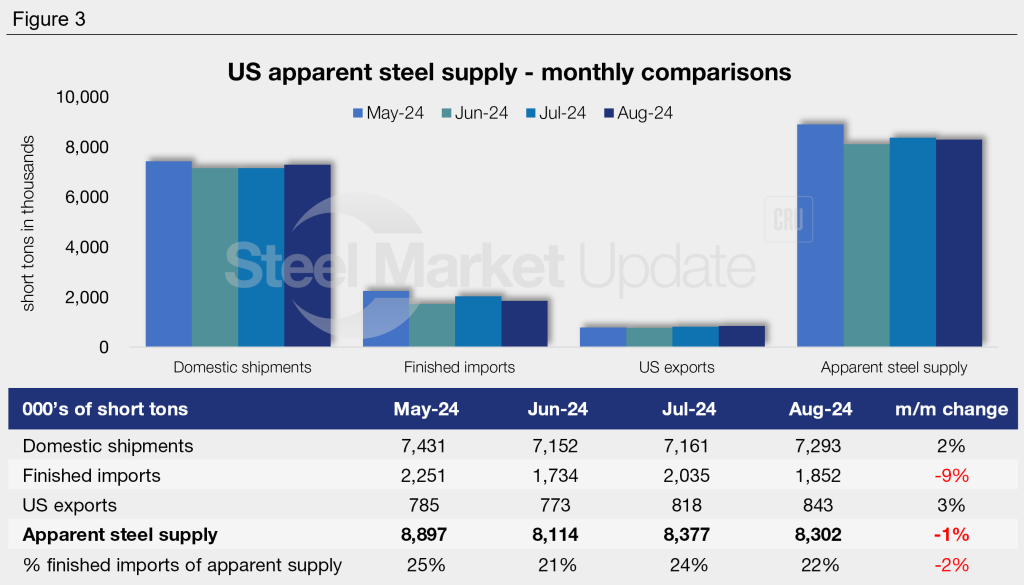
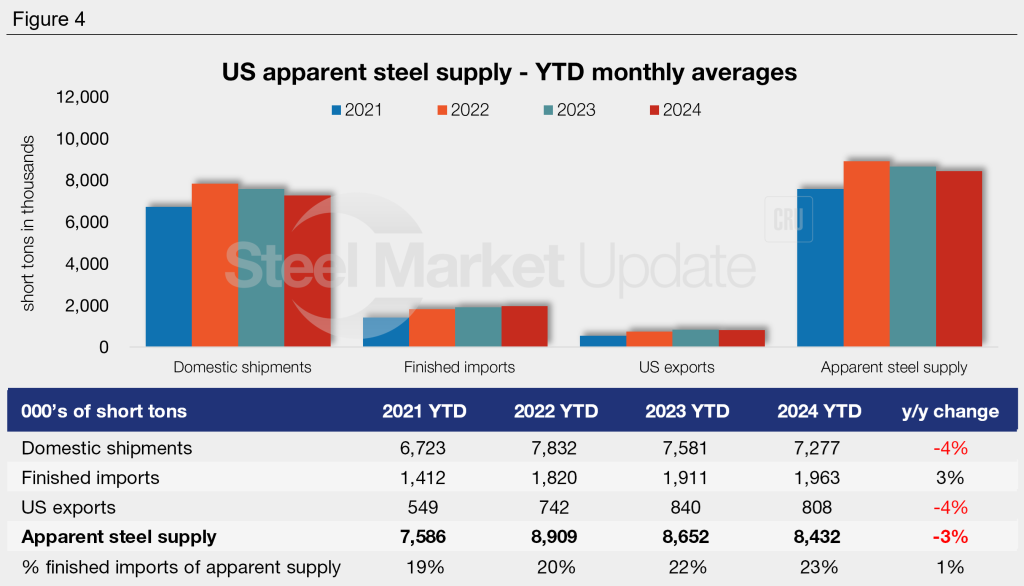
Figure 4 shows year-to-date (YTD) monthly averages for each statistic over the last four years. The average monthly supply level for the first eight months of 2024 now stands at 8.43 million st, 3% less than the same period last year. The highest YTD monthly average in our recent history was for 2022 at 8.91 million st. In this time we have seen consistent growth in finished imports, while domestic shipments and total exports have fluctuated.
To see an interactive graphic of our apparent steel supply history, click here. If you need any assistance logging into or navigating the website, contact us at info@steelmarketupdate.com.