Analysis
October 12, 2024
US steel imports tick up in August, fall again in September
Written by Brett Linton
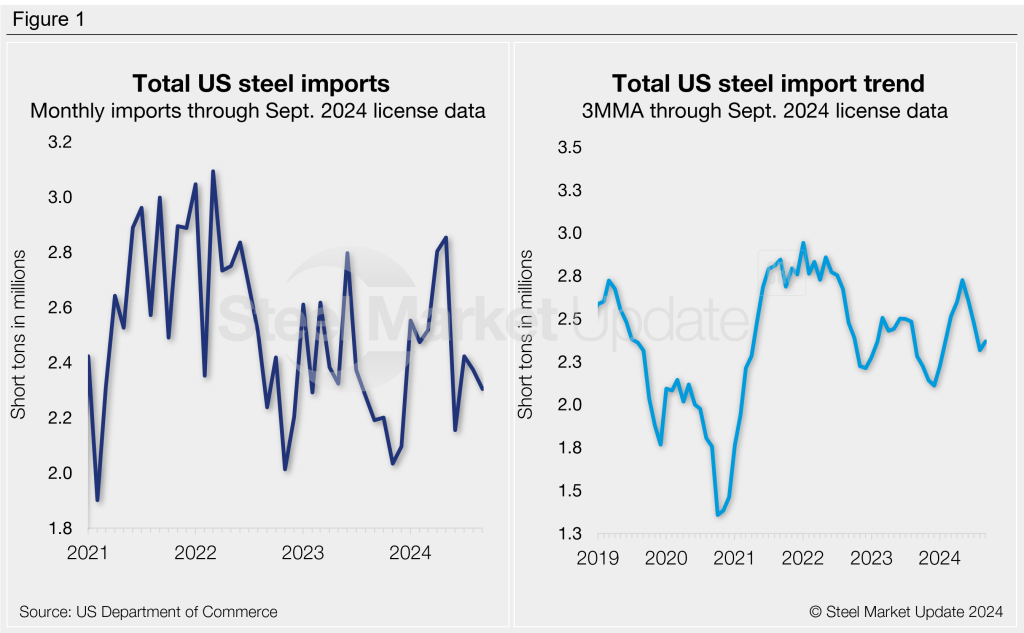
August steel imports totaled 2.38 million short tons (st), according to final data released this week by the US Commerce Department. That was down 2% from July and is the second-lowest monthly rate recorded this year. Data collected through Oct. 6 shows September licenses totaling 2.30 million st, which would be a 3% drop from August (Figure 1, left).
Almost half of all the steel that entered the US in August came from just three countries: Canada (21%), Brazil (19%), and South Korea (11%). Other significant contributors included Mexico (7%), Vietnam (6%), and Germany (5%). Japan, Taiwan, and Romania are also worth mentioning (3-4%).
The International Trade Administration’s Steel Import Monitor is an excellent resource to explore imports by specific product or country.
Smoothing out the data
To smooth out the variability seen in monthly data and better highlight trends, we can look at imports on a three-month moving average (3MMA) basis (Figure 1, right). From this perspective, final August imports eased to a seven-month low of 2.32 million st. The 3MMA through September is currently up slightly to 2.37 million st. Recall that we saw a 22-month high 3MMA of 2.73 million st back in May.
For comparison, the average monthly import rate in 2023 was 2.35 million st, while the first eight months of 2024 have averaged 2.52 million st per month.
Semi-finished vs. finished breakdown
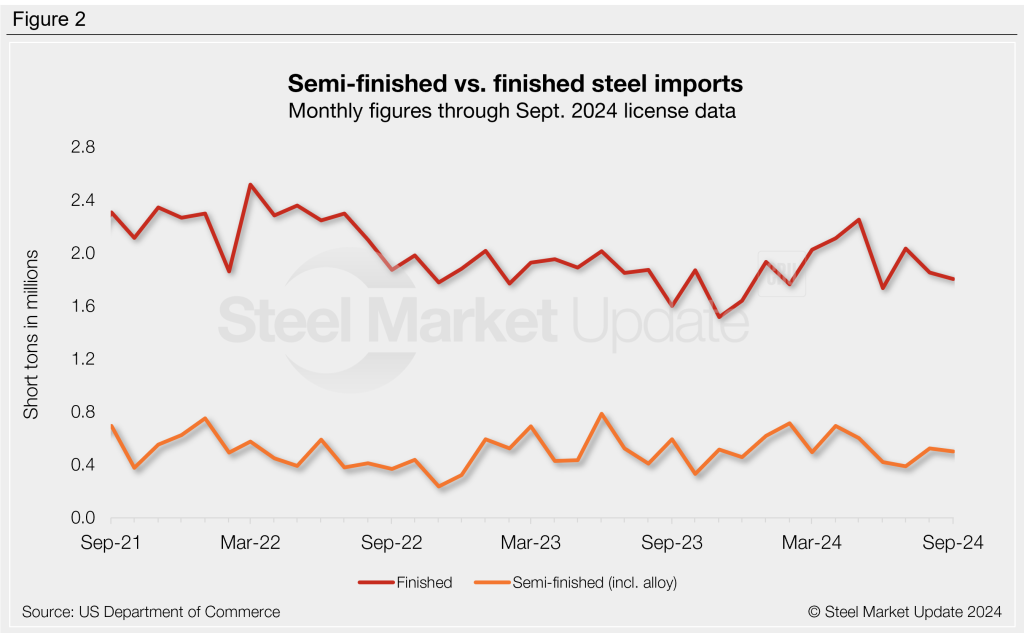
As shown in Figure 2, semi-finished steel imports jumped 35% from a nine-month low in July to 524,000 st in August. September’s license count is currently 4% below August at 501,000 st. For reference, semi-finished steel imports averaged 524,000 st per month last year. 2024 has seen a monthly average of 557,000 st through August figures.
Meanwhile, imports of finished steel products totaled 1.85 million st in August, a 9% drop from July. September’s license count of 1.80 million st suggests a further 3% month-on-month (m/m) decline. Finished imports averaged 1.83 million st per month in 2023, whereas the monthly average for the first eight months of 2024 now stands at 1.96 million st.
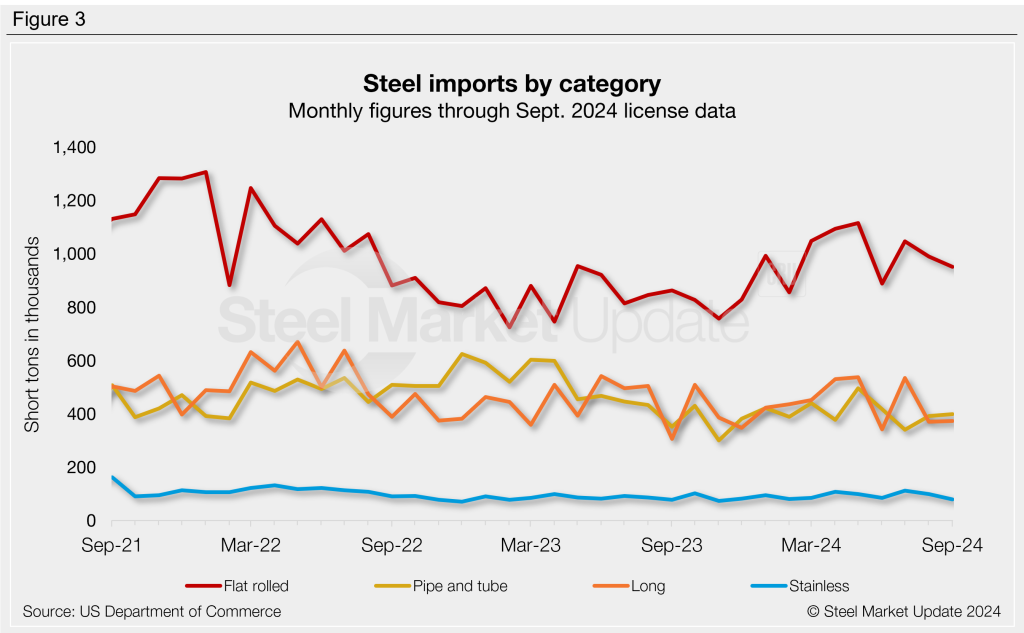
Imports by category
Figure 3 shows monthly imports by product category. Following an increase in July, flat-rolled steel imports eased 6% m/m in August to 990,000 st. The latest license data shows a likely 4% decline in September to 951,000 st.
Following a July surge, imports of long products slipped 31% in August to 371,000 st. September licenses are currently right in line with August at 373,000 st.
Pipe and tube imports rebounded 15% from July’s eight-month low to 392,000 st in August. September licenses are up another 2% to 399,000 st.
Stainless imports fell 12% from July’s two-year high, totaling 98,000 st in August. September stainless projections are currently at 79,000 st, potentially down 19% m/m.
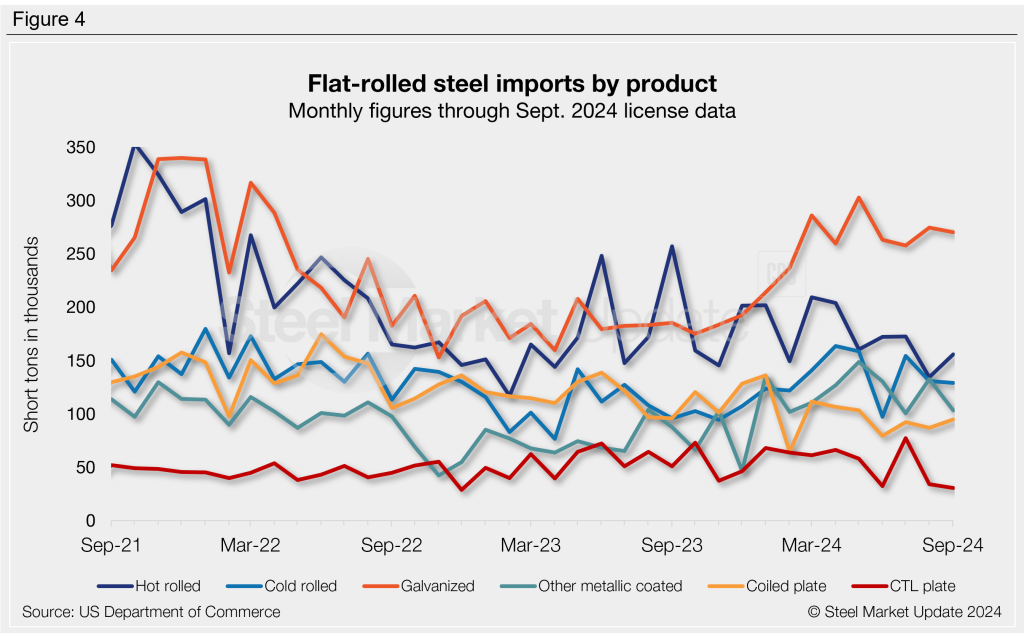
Flat-rolled imports
Figure 4 shows flat rolled imports by popular products. The largest monthly mover from July to August was cut to length plates (-56%), followed by other-metallic coated (+32%), hot-rolled coil (-22%), and cold-rolled coil (-15%).
September licenses are mostly down across the products we track. Current data indicates significant drops are expected in tin plate (-30%), other-metallic coated (-22%), and plate cut lengths (-10%). The two products expected to rise in September are HR coil (+16%) and plate in coils (+9%).
Imports by product
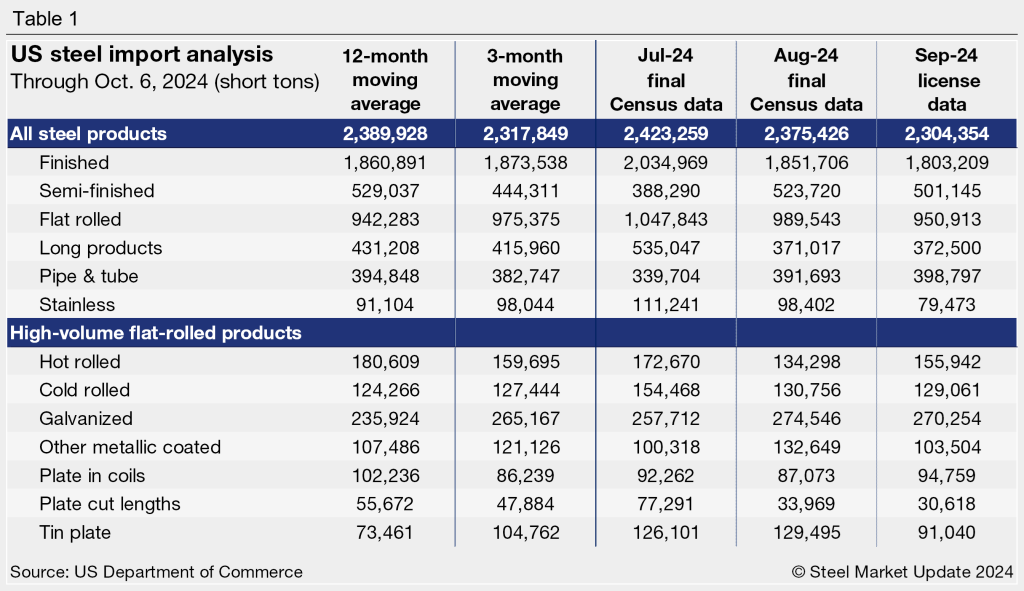
Table 1 provides further detail into imports by product, highlighting high-volume steel products. Explore this steel trade data deeper on the Steel Imports page of our website.