

Analysis
September 10, 2024
Steel exports recover in July
Written by Brett Linton
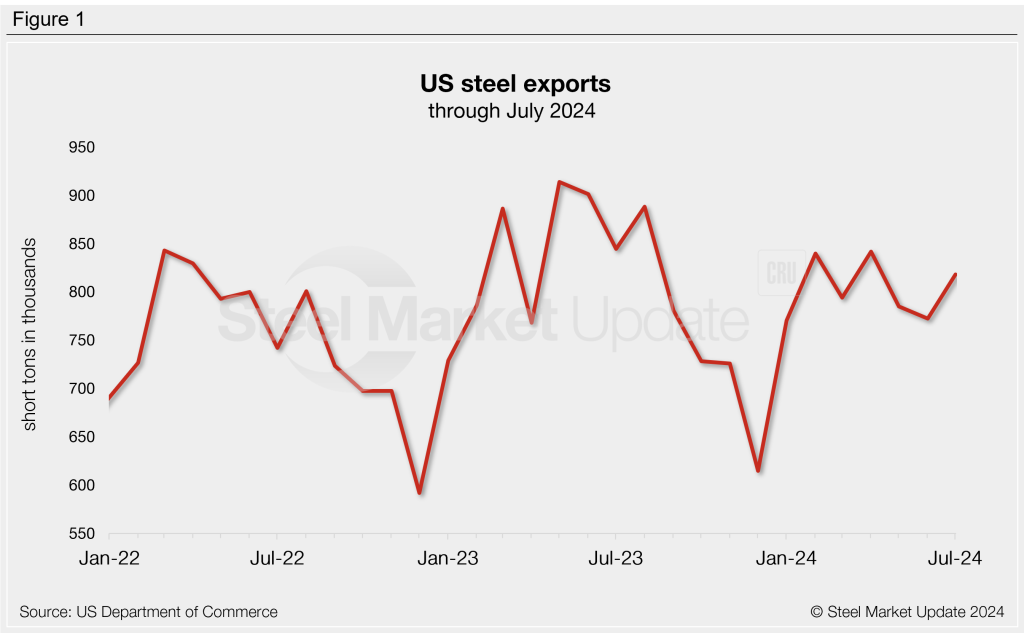
Following May’s five-month low, US steel exports ticked higher in July, according to the latest US Department of Commerce data. The amount of steel exiting the country rose 6% month on month (m/m) to 818,000 short tons (st). This is back in line with trade levels seen in recent months.
July exports are 2% greater than the average monthly rate of 2024 to date (803,000 st), but down 3% from the same month last year (845,000 st).
Monthly averages
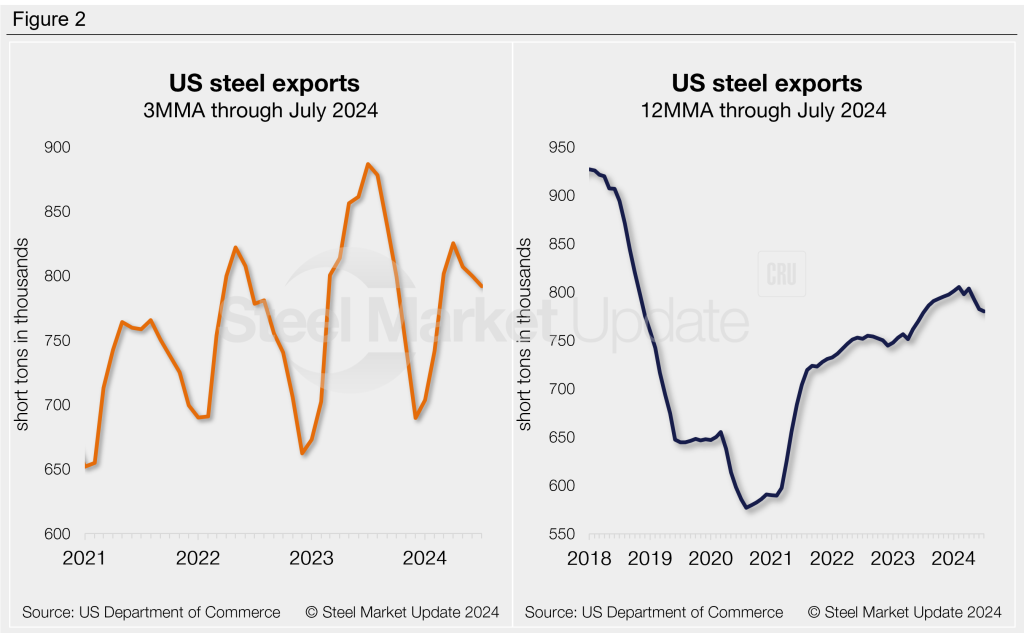
Looking at exports on a three-month moving average (3MMA) basis can smooth out the fluctuations seen month to month. Export volumes had trended downward throughout the second half of last year. The 3MMA changed course as it entered 2024, peaking at 825,000 st in April. The 3MMA has declined since then but remains relatively strong in July at 792,000 st, down 4% from April’s high.
Exports can be annualized on a 12-month moving average (12MMA) basis to further dampen month-to-month variations and highlight historical trends. From this perspective, steel exports have overall moved higher since 2020. The 12MMA reached a five-and-a-halfd-year high in February (805,000 st), easing each month since. The 12MMA through July remains healthy at 780,000 st, but is the lowest rate recorded over the last year.
Exports by product
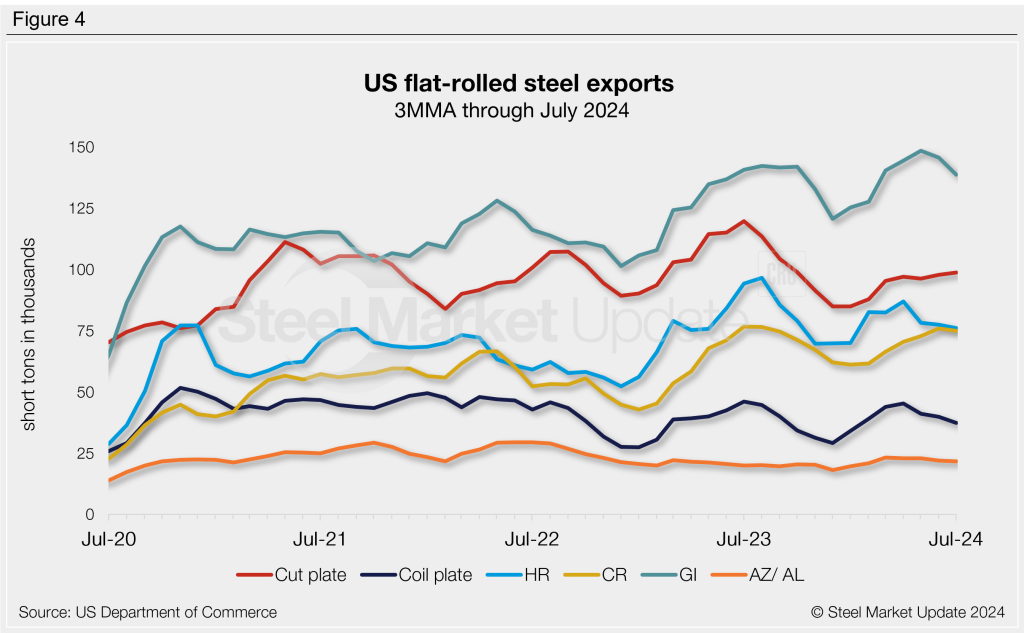
Changes in monthly export rates were mixed across the major flat-rolled steel products we track, with four moving higher and three declining. The biggest monthly movers from June to July were hot-rolled sheet (+15%), other-metallic coated (+14%), and coiled plate (-13%).
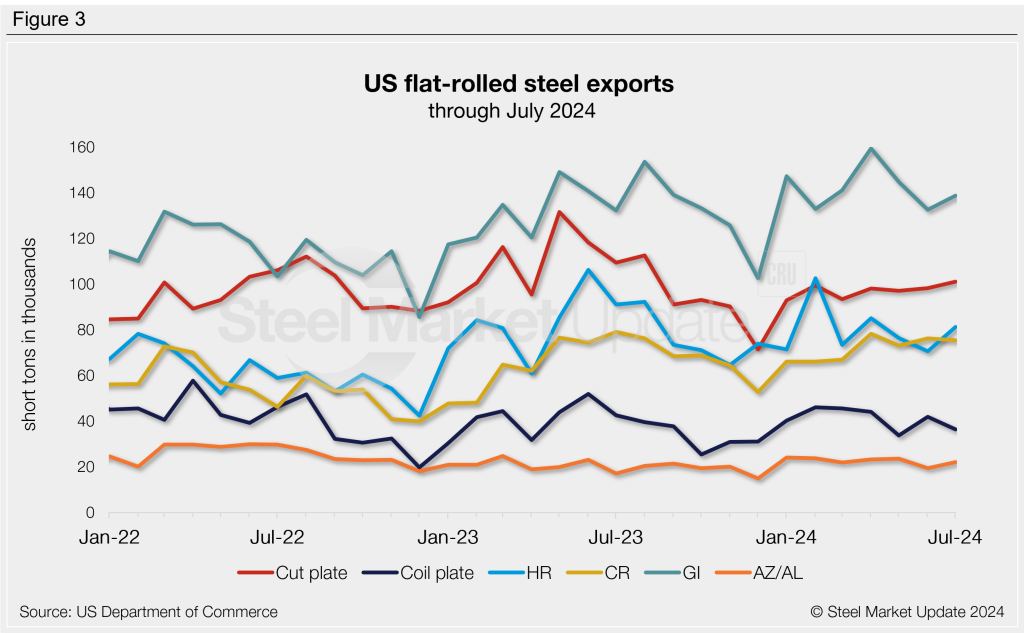
Exports of most products were down compared to the same month last year, apart from galvanized sheet and other-metallic coated. Significant year-on-year (y/y) changes were witnessed in other-metallic coated exports (+30%), plate in coils (-14%), and hot-rolled sheet (-11%).
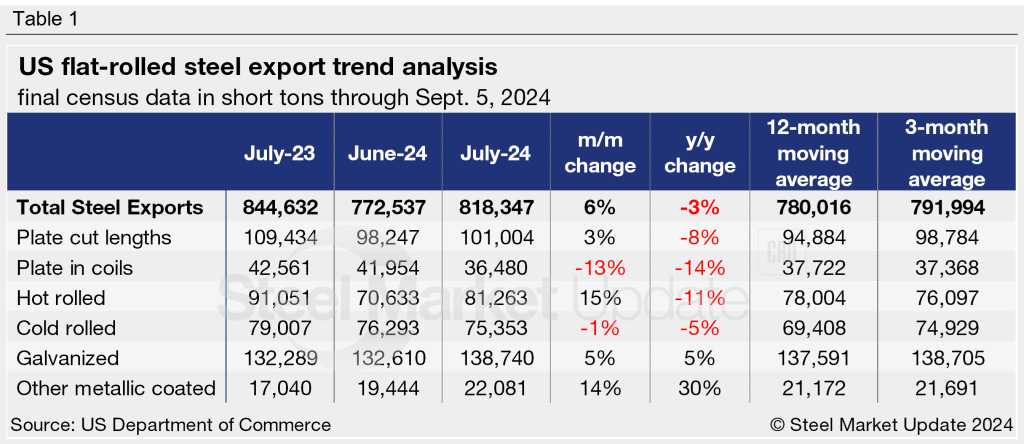
Figure 4 shows a history of exports by product on a 3MMA basis.
Note that most steel exported from the US is destined for USMCA trading partners Canada and Mexico. Over half of all exports in July went to Mexico (54%), followed by 38% to Canada. The next largest recipients were Honduras at 1% (with an unusual surge in semi-finished exports), followed by China, Brazil, and the Dominican Republic at less than 1% each.