Analysis
September 6, 2024
US steel imports slipped in August after rising in July
Written by Brett Linton
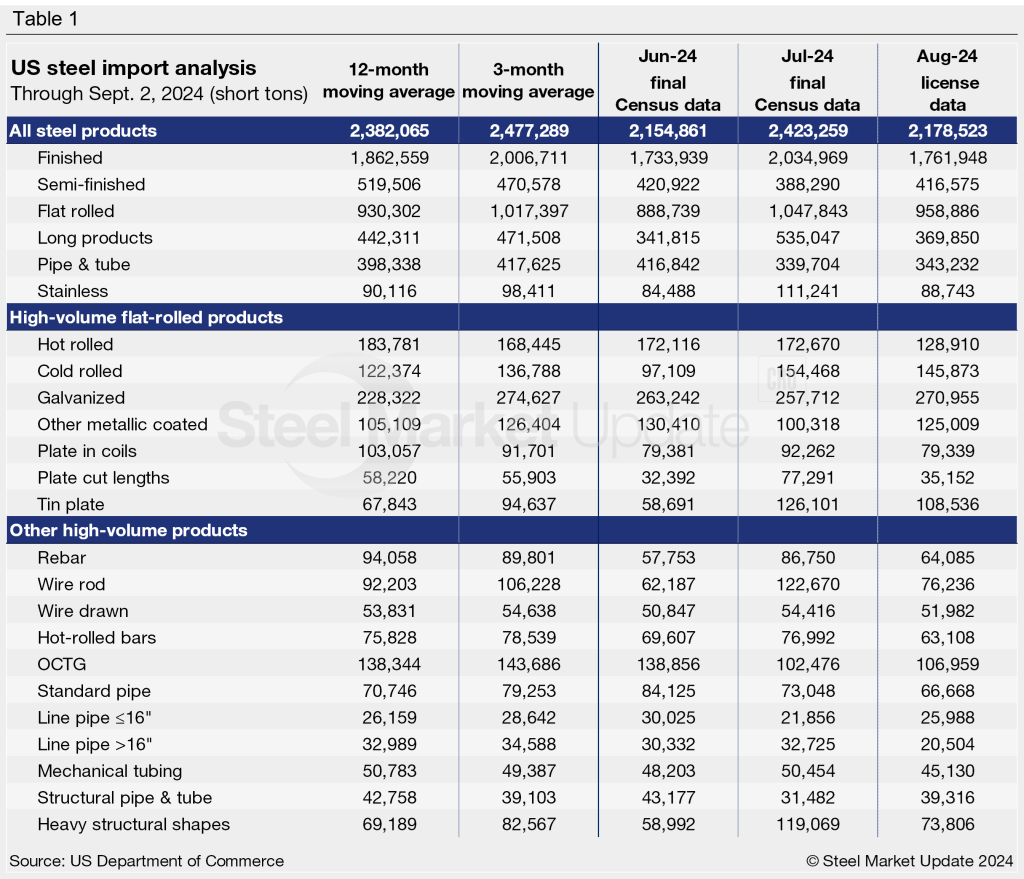
Final July steel imports rose 12% from the month prior to 2.42 million short tons (st), according to the latest US Commerce Department figures. July represents the second-lowest monthly import rate so far this year. August import licenses currently total 2.18 million st as of Sept. 2, a potential decline of 10% m/m.
Canada remains the largest exporter of steel to the US, representing approximately 22% of total July imports. Other significant contributors include Brazil (17%), South Korea (8%), Mexico (7%), Japan (6%), and Germany (5%). Taiwan, China, and Vietnam are also worth mentioning (3-4%). If you want to dive deeper into imports by product or country, the International Trade Administration has an excellent website to do so.
Smoothing out the data
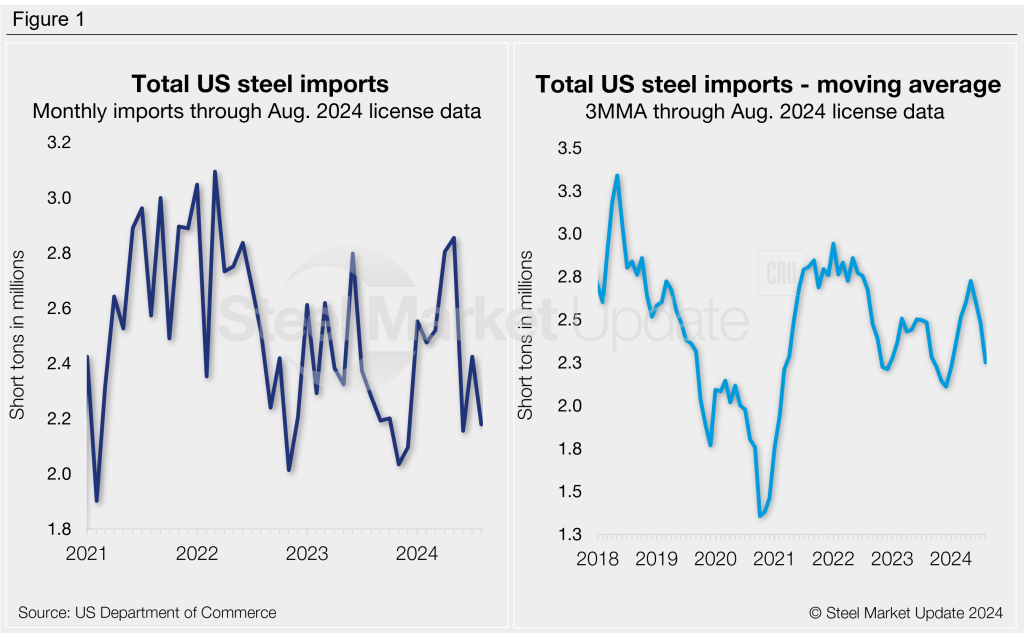
To smooth out the variability in the monthly data, we can look at imports on a three-month moving average (3MMA) basis. On this basis, imports through final July data were at 2.48 million st. Recall that we saw a 22-month high 3MMA of 2.73 million st in May. The 3MMA through August is down further, currently at a seven-month low of 2.25 million st.
For comparison, the average monthly import rate in 2023 was 2.35 million st, while the first seven months of 2024 averaged 2.54 million st.
Semi-finished vs. finished breakdown
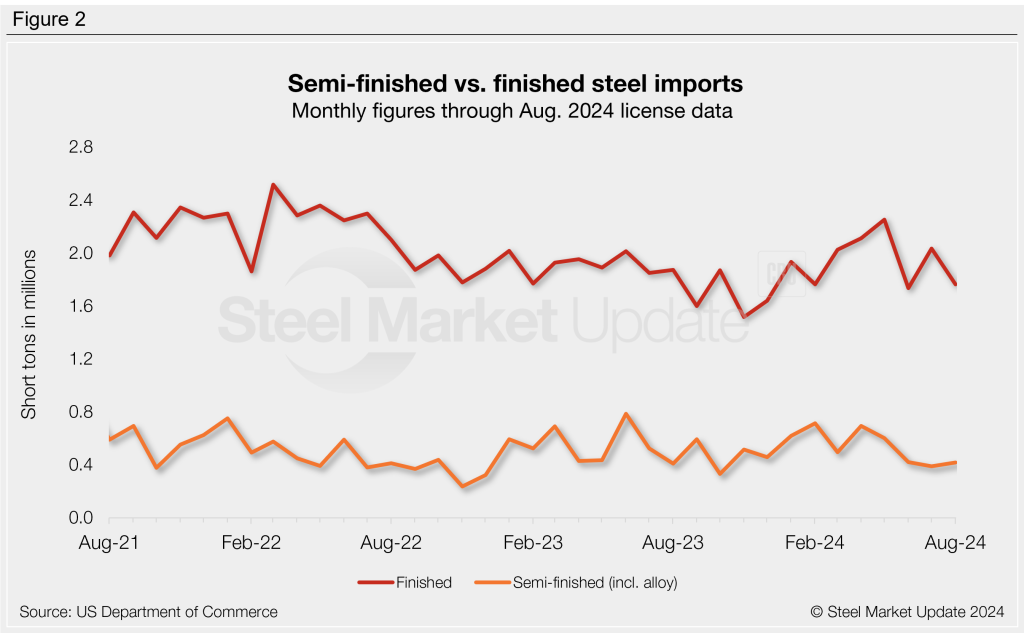
Semi-finished steel imports fell 8% m/m in July to a nine-month low of 388,000 st. August licenses currently total 416,000 st, 7% greater than July. For reference, semi-finished imports averaged 524,000 st per month last year. 2024 has seen a monthly average of 561,000 st through July figures.
Meanwhile, imports of finished steel products totaled 2.03 million st in July, a 17% jump from June. The latest finished import tally through August declined 13% to 1.76 million st. Finished imports averaged 1.83 million st per month in 2023, whereas the monthly average for the first seven months of 2024 now stands at 1.98 million st.
Imports by category
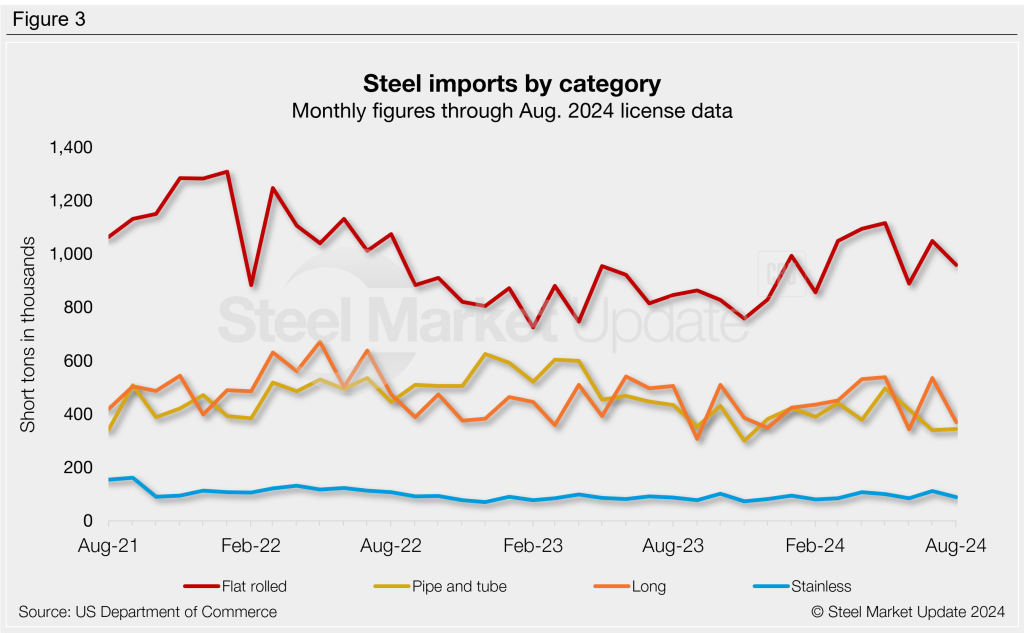
Figure 3 shows monthly imports by product category. Following June’s dip, flat-rolled steel imports increased 18% in July to 1.05 million st. License data suggests a potential 8% decline in August.
Imports of long products bounced back in July, surging 57% from June’s nine-month low to 535,000 st. August licenses currently show a decline of 31% m/m to 370,000 st.
Pipe and tube imports fell 19% in July to an eight-month low of 340,000 st. August licenses are up 1%.
Stainless imports rose 32% from June to a two-year high of 111,000 st in July. August stainless projections are currently at 89,000 st, potentially down 20% from July.
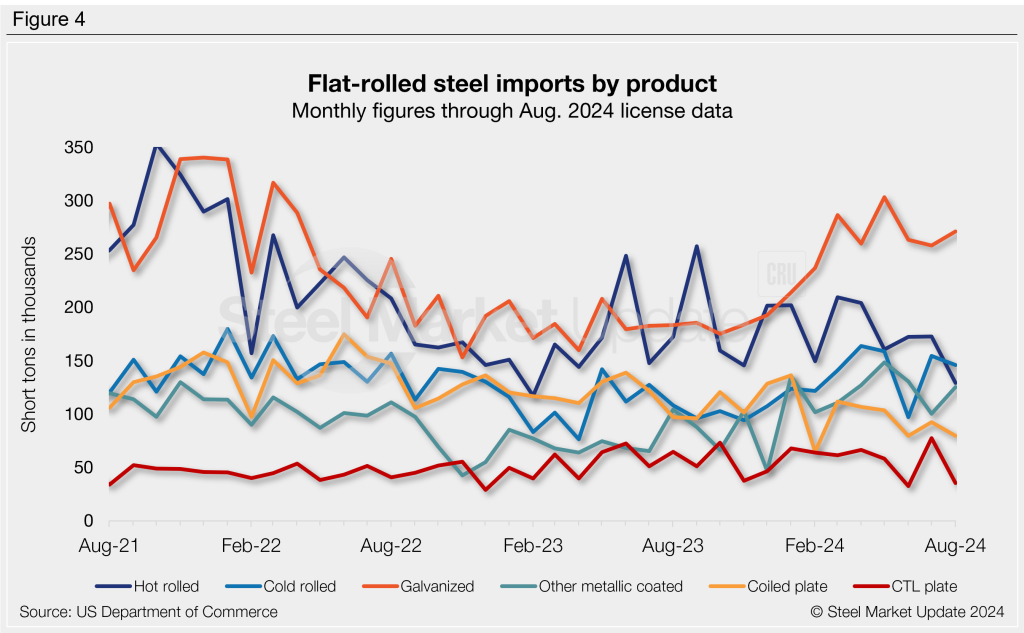
Flat-rolled imports
Figure 4 shows flat rolled imports by popular products. July imports ticked higher for all but two categories following June’s dip. The largest monthly mover was cut-to-length plates (+139%), followed by tin plate (+115%), cold-rolled coil (+59%), and other metallic coated (-23%).
August licenses are mostly down across the products we track. Current data indicates significant declines in CTL plates (-55%), hot rolled (-25%), plate in coils (-14%), and tin plate (-14%).
Imports by product
The chart below provides further details on imports by product, highlighting high-volume steel products. Explore this steel trade data deeper on the Steel Imports page of our website.