Market Data

June 27, 2024
Steel imports rally through May, possibly fall in June
Written by Brett Linton
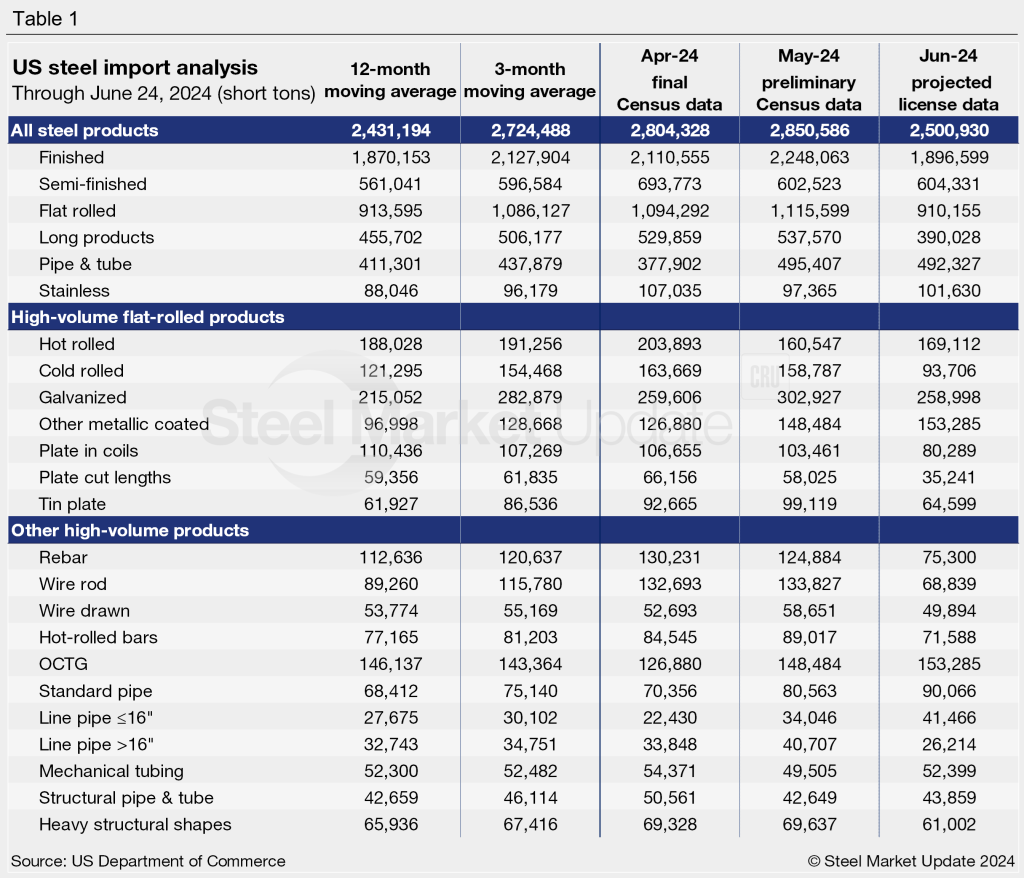
Following a relatively stable first quarter, steel imports climbed in May to levels not seen in over two years, according to preliminary Census data released earlier this week. Projected June license data suggests imports could ease from May but still be strong compared to levels witnessed over the past year.
The US Commerce Department’s preliminary count shows 2.85 million short tons (st) of steel products entered the country last month. This is up 2% from 2.80 million st in April and likely the highest month for imports since March 2022 (3.09 million st).
The latest projections on June import licenses are at 2.50 million st, which would be a 12% decline from May. Note that license data is still being collected, so June figures could fluctuate from here. The left graph in Figure 1 below displays a 3.5-year history of monthly steel imports.
Imports as a 3MMA
Looking at imports on a three-month moving average (3MMA) basis can smooth out the variability seen from month to month and better showcase long-term trends.
On a 3MMA basis, imports through preliminary May data rose to a 22-month high of 2.74 million st. The May 3MMA is up 5% from the previous month and 22% from the start of the year.
The 3MMA through projected June license data is down by a hair to 2.72 million st. The right graph in Figure 1 shows a snapshot of total steel imports on a 3MMA basis since 2018.
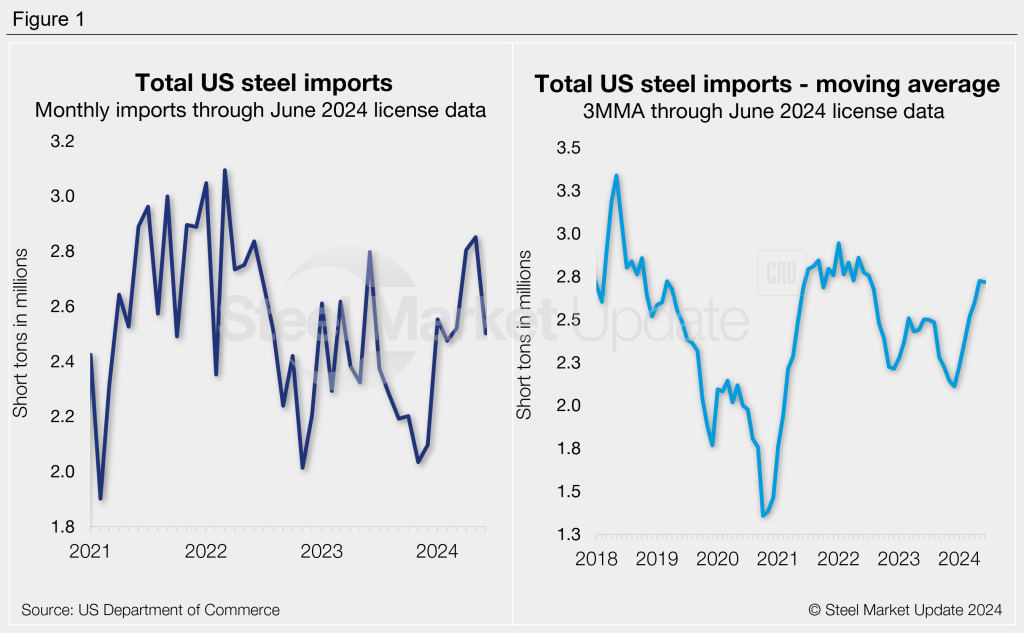
Semi-finished and finished steel
Imports of semi-finished steel eased 13% from April to 603,000 st in May, according to the latest preliminary data. Projected June licenses are flat month-on-month (m/m) at 604,000 st. For reference, monthly semi-finished imports averaged 524,000 st in 2023 and 621,000 st in the first six months of this year.
Meanwhile, May finished steel imports increased 7% from April to a 22-month high of 2.25 million st. The finished import tally through June is down 16% to 1.90 million st, the lowest monthly rate seen since February. Finished imports averaged 1.83 million st per month in 2023, whereas the monthly average for 2024 now stands at 2.00 million st.
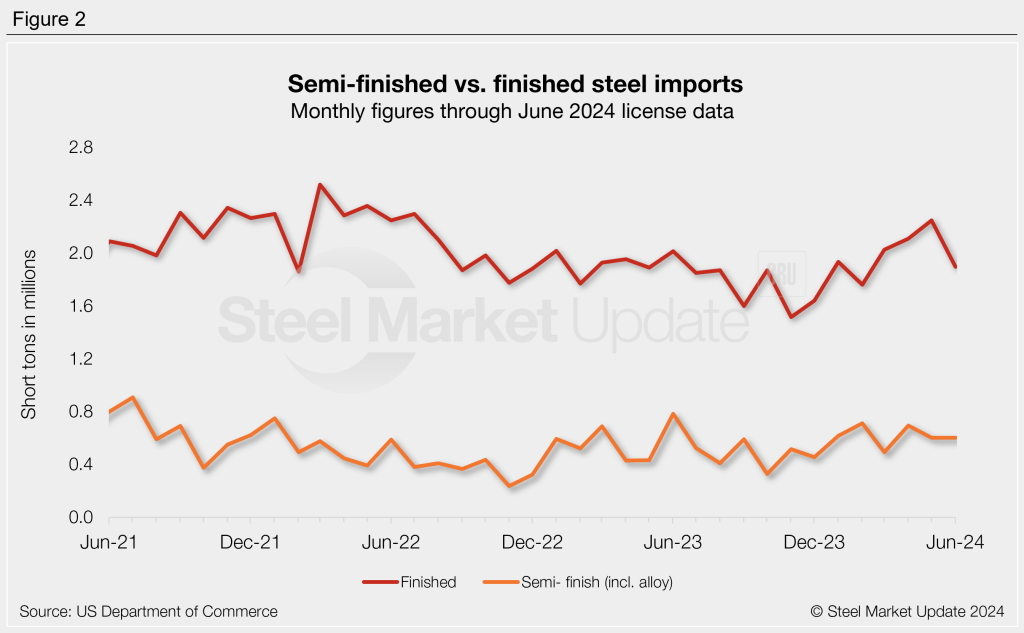
Imports by category
Figure 3 graphs monthly imports by product category. Preliminary figures show flat-rolled steel imports rising 2% m/m in May to a 23-month high of 1.12 million st. June license projections are down 18% from May at 910,000 st, potentially a four-month low.
Imports of long products rose 1% in May to an 11-month high of 538,000 st; June projections are down 27% to 390,000 st. Pipe and tube imports jumped 31% in May to 495,000 st, but potentially eased 1% in June to 492,000 st. Stainless imports fell 9% m/m to 97,000 st in May, coming down from April’s 20-month high. June stainless import projections are currently 4% higher than May at 102,000 st.
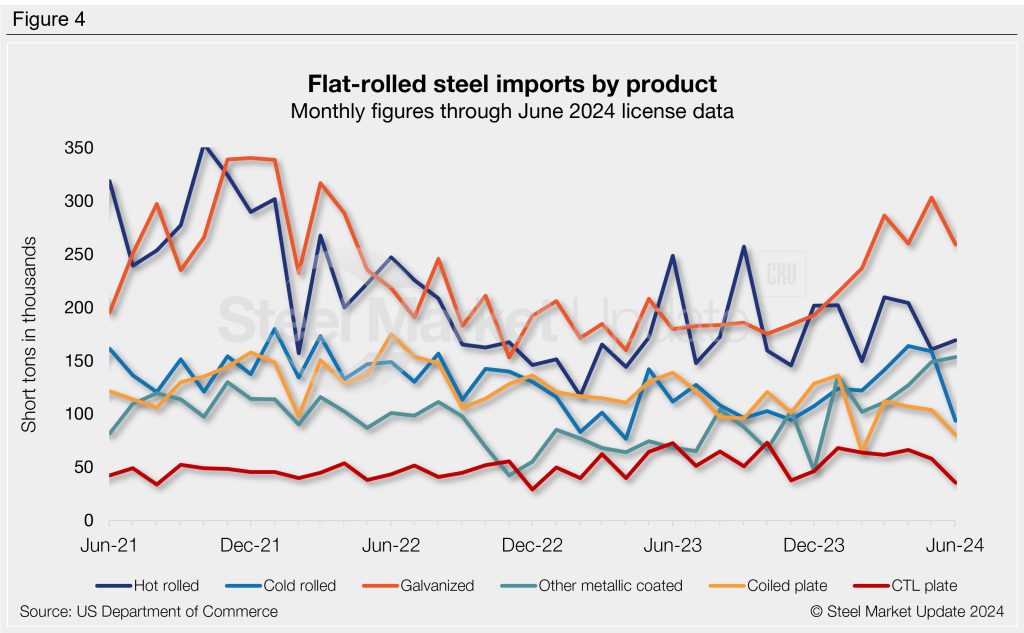
Flat-rolled steel products
Figure 4 shows flat rolled imports by popular products. Flat rolled imports moved in differing directions from April to May, with significant movements seen in hot rolled (-21% m/m) and galvanized and Galvalume (both +17%). Imports of most products are projected to decline from May to June, with large drops expected in cold rolled (-41% m/m), plate cut lengths (-39%), tin plate (-35%), plate in coils (-22%), and galvanized (-15%).
Imports by product
The chart below provides further details on imports by product, highlighting high-volume steel products.