Prices

June 20, 2024
HR futures: Market changes gears
Written by Daniel Doderer
For the first time in weeks, activity in the futures market broke out of the recent “front grinds lower” pattern to provide new insight into the dynamics of the steel industry.
The chart below shows the forward curves from 10 weeks ago (pink), four weeks ago (blue), last week (orange), and today (white). The histogram below explicitly shows how the curve has changed compared to two weeks ago. What is most notable here is how fluctuations in the curve can be viewed in tandem with changing sentiment.
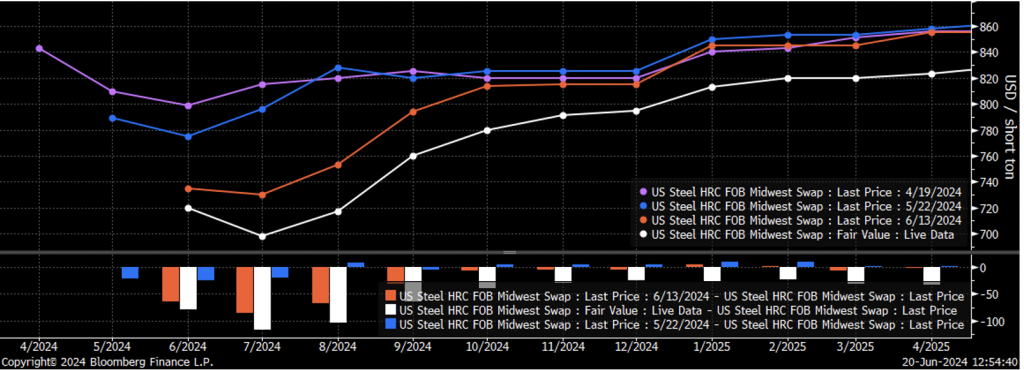
In the middle of April (pink), when the forward curve first moved into contango, it was clear that the market was operating in a surplus. Demand was coming in soft with a backdrop of elevated domestic production and import arrivals at their highest levels in nearly two years. Over the next month, the front of the curve slid by ~$40 as the surplus worsened and imports surged (along with many measures of inventory). However, the back of the curve (August, onward) was essentially unchanged. This trend continued through last week. The front of the curve continued to sell off, along with a continued deterioration in expectations for when the market would be able to chew through the sustained surplus. Over this entire period, a variety of spot price assessments slowly drifted lower as the market tentatively looked for a bottom.
Then came Wednesday, when the CRU HRC Index came in well below market expectations and shook many weary participants into the realization that market expectations needed to be reset. We come to that conclusion because the entire curve shifted lower rather than just in the front. This signals an overarching reassessment of upside/downside risk dynamics and the supply/demand balance. Most notably, the fact that industrial data and sentiment surveys continue to sputter – construction spending, ISM Manufacturing PMI, housing starts, building permits, Fed manufacturing surveys, durable goods, and auto production/inventories. That’s just to name a few.
Another important piece of the puzzle here is what is happening on the steel cost side. Since more than 70% of domestic production comes from EAFs, that means looking at busheling. The chart below shows the CME Busheling futures curve from two Fridays before the June settlement (blue), and then today (white), along with the eventual June settle in the red circle.
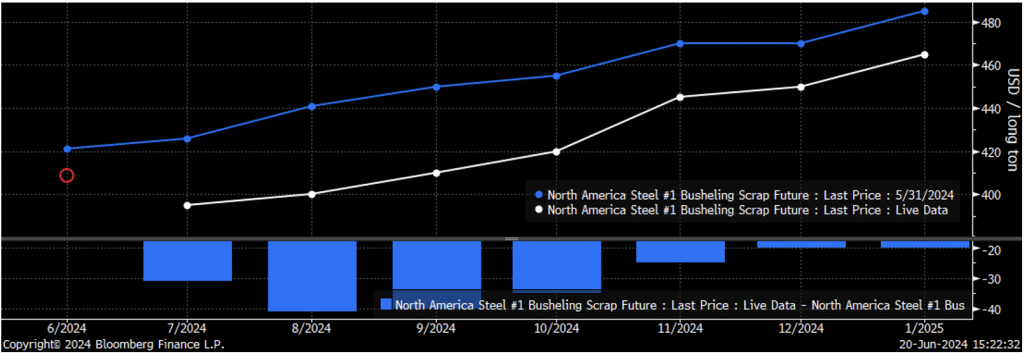
Unambiguously, the print and outlook in the scrap market shifted lower as June settled below expectations, with mills citing softer downstream demand. The implications for steel pricing is also clear, while lower costs lead to a temporary relief in margins, there is an increased willingness to sell finished material at a lower price as well.
Finally, the chart below is managed money net contracts in white, with long (blue) and short (red) positioning broken out. As we always mention, we like to look at managed money because it is the best stand-in for speculative positioning – these are the firms that are furthest away from the physical market. Also of note, the data is as of June 11 – we will have to wait two more Fridays for full insight into how traders positioned themselves following Wednesday’s activity.
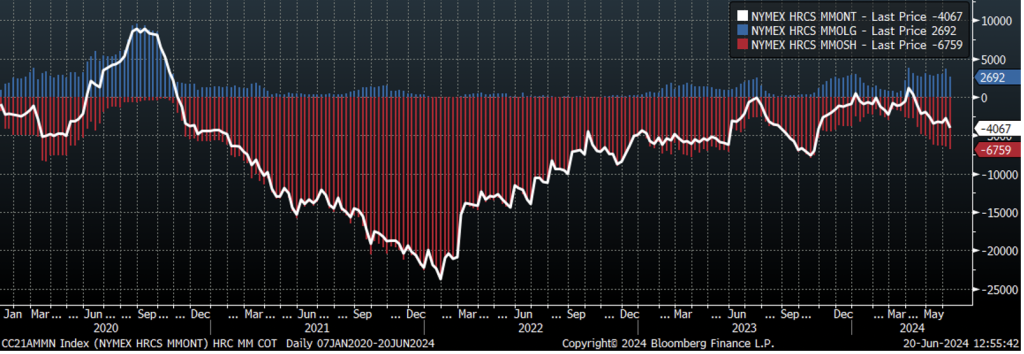
What is notable here, though, is the fact that money managers have been increasing their short positioning over the past two months to a level not seen since October 2023. At that time, the “front” of the curve (contract months 2-4) was more than $100 higher than when speculators started shorting in April.
Disclaimer: The content of this article is for informational purposes only. The views in this article do not represent financial services or advice. Any opinion expressed by Flack Global Metals or Flack Capital Markets should not be treated as a specific inducement to make a particular investment or follow a particular strategy, but only as an expression of his opinion. Views and forecasts expressed are as of date indicated, are subject to change without notice, may not come to be and do not represent a recommendation or offer of any particular security, strategy or investment. Strategies mentioned may not be suitable for you. You must make an independent decision regarding investments or strategies mentioned in this article. It is recommended you consider your own particular circumstances and seek the advice from a financial professional before taking action in financial markets.