Market Data
June 13, 2024
June energy market update
Written by Brett Linton
In this Premium analysis we cover North American oil and natural gas prices, drilling rig activity, and crude oil stock levels. Trends in energy prices and rig counts are an advanced indicator of demand for oil country tubular goods (OCTG), line pipe, and other steel products.
The Energy Information Administration’s (EIA) June Short-Term Energy Outlook (STEO) was released earlier this week, forecasting spot prices, production, and inventories for crude oil and natural gas. Crude oil prices are forecast to ease slightly through the remainder of the year, while natural gas prices are expected to move higher following recent lows. You can view the latest EIA Short-Term Energy Outlook here.
Oil and gas spot prices
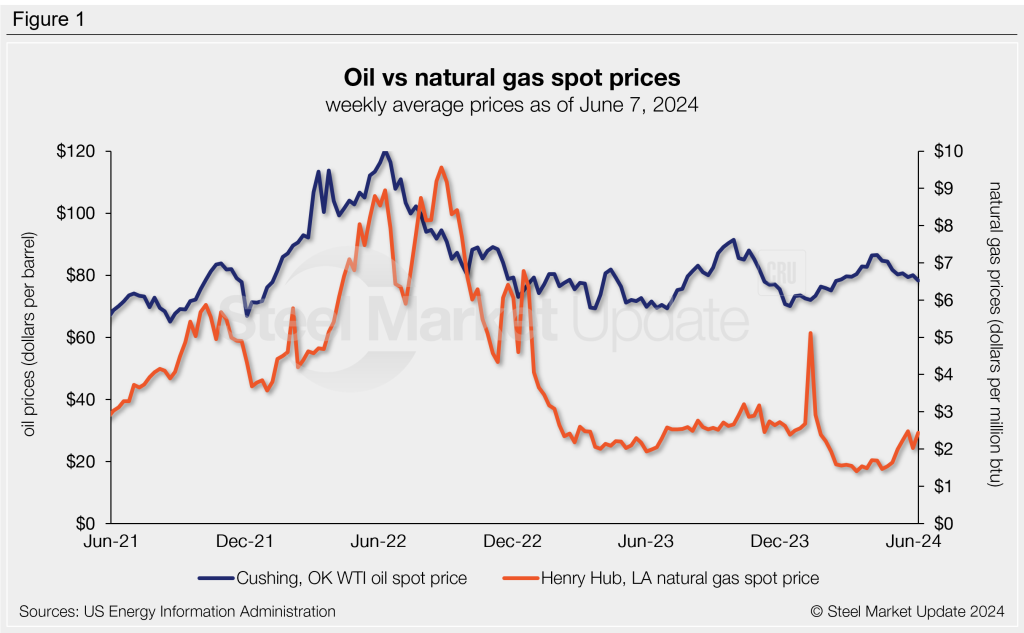
The weekly West Texas Intermediate oil spot market price has remained relatively stable over the last year. Prices gradually recovered in the first four months of this year following December’s low, peaking at a weekly average of $86.50 per barrel (b) in mid-April. Prices have since ticked lower over the last eight weeks. The spot price stands at $78.31/b as of last week (Figure 1). The EIA expects oil spot prices to average $85/b in the second half of 2024, driven higher by ongoing geopolitical tensions and less OPEC+ production.
Their latest release explains that OPEC+ production cuts were previously expected to begin in the third quarter of this year, but have since been delayed until the fourth quarter. EIA expects these cuts will reduce global oil inventories through the remainder of the year and put upward pressure on prices.
Natural gas spot prices have gained momentum over the last month following their historical lows. Recall that prices reached a 25-year low in mid-March of $1.40 per metric million British thermal units (mmBtu). The EIA attributed these low prices to historically high inventory levels due to reduced winter consumption. Natural gas prices have recovered to $2.43/mmBtu as of last week. The June STEO forecasts natural gas to average $2.60/mmBtu in the third quarter, with higher prices supported by reduced production and increased seasonal demand from the electric power sector.
Rig counts
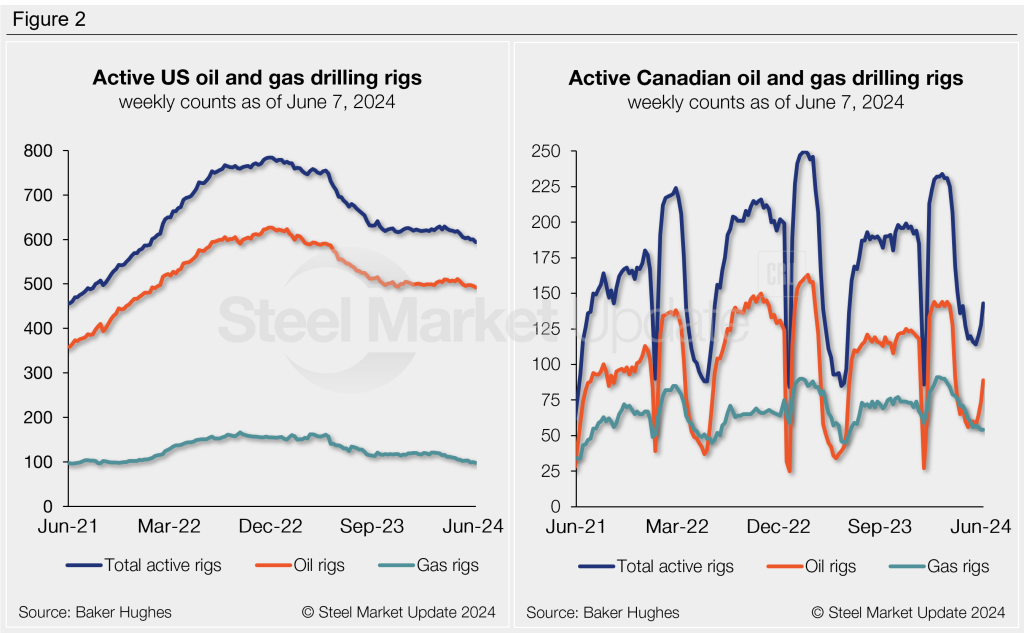
The number of active US oil and gas drill rigs has eased 2% each of the past two months, following a relatively stable period from October through March. The latest US count is down to 594 active drill rigs as of the end of last week according to Baker Hughes (Figure 2). This is now the lowest weekly count recorded since the first week January 2022. Active rig counts are 15% lower than levels seen one year ago.
Canadian rig activity has seen an uptick recently, rising each of the past three weeks. As seen on the right chart in Figure 2, Canadian counts experience seasonal swings each spring as warmer weather sets in and thawing ground conditions limit access to roads and sites. Active Canadian rigs through this week total 143, up 5% compared to counts this time last year.
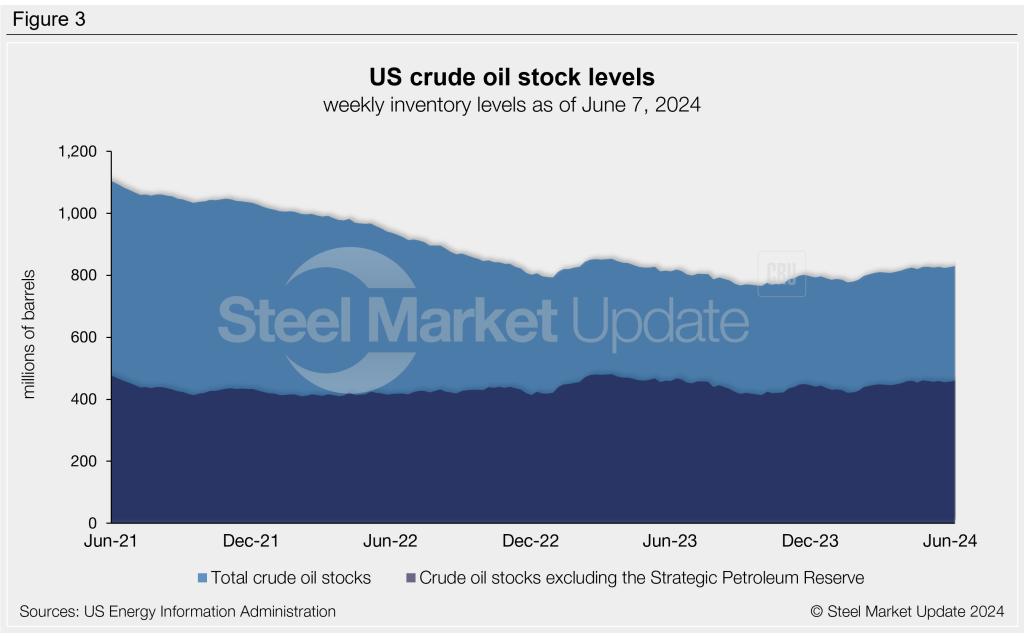
Stock levels
US crude oil stocks continue to increase following the 38-year low reached last September (765 million barrels). Through last week, stock levels are up to a 14-month high of 830 million barrels. June stocks are 5% higher than the start of the year and 1% greater than levels one year ago (Figure 3).