

Market Data
June 13, 2024
Apparent steel supply reached 8-month high in April
Written by Brett Linton
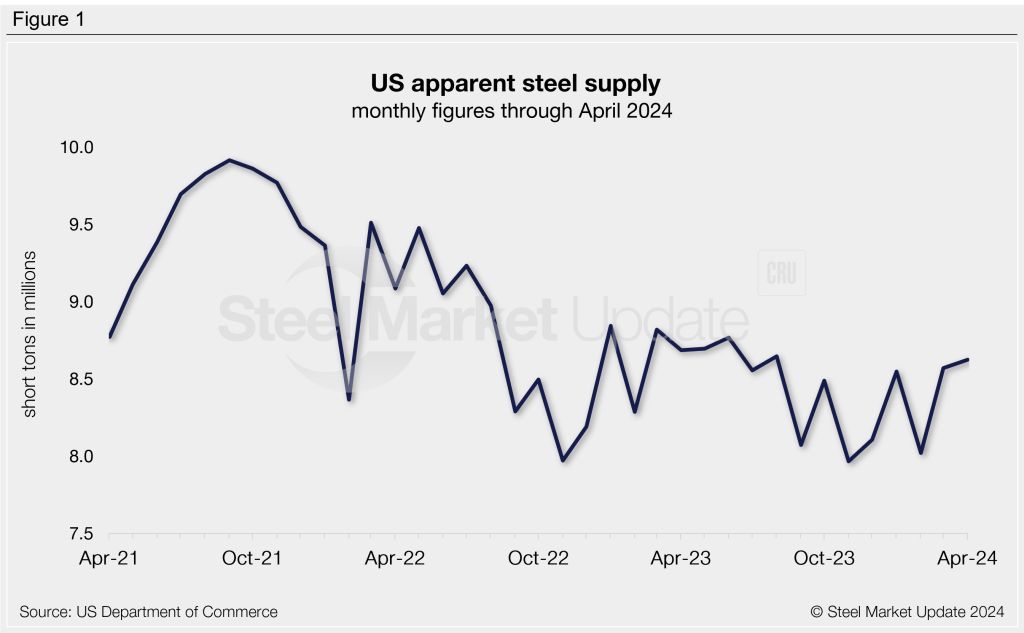
The amount of finished steel available in the US market rose 1% from March to April, according to SMU calculations of Department of Commerce and American Iron and Steel Institute (AISI) data.
Referred to as ‘apparent steel supply,’ we calculate this volume by combining domestic steel mill shipments and finished US steel imports, then deducting total US steel exports.
Following a strong March, apparent supply ticked up to 8.62 million short tons (st) in April, the highest level seen since August. While high relative to recent months, April’s supply was just 2% higher than the average monthly supply rate of the past year (8.42 million st).
Trends
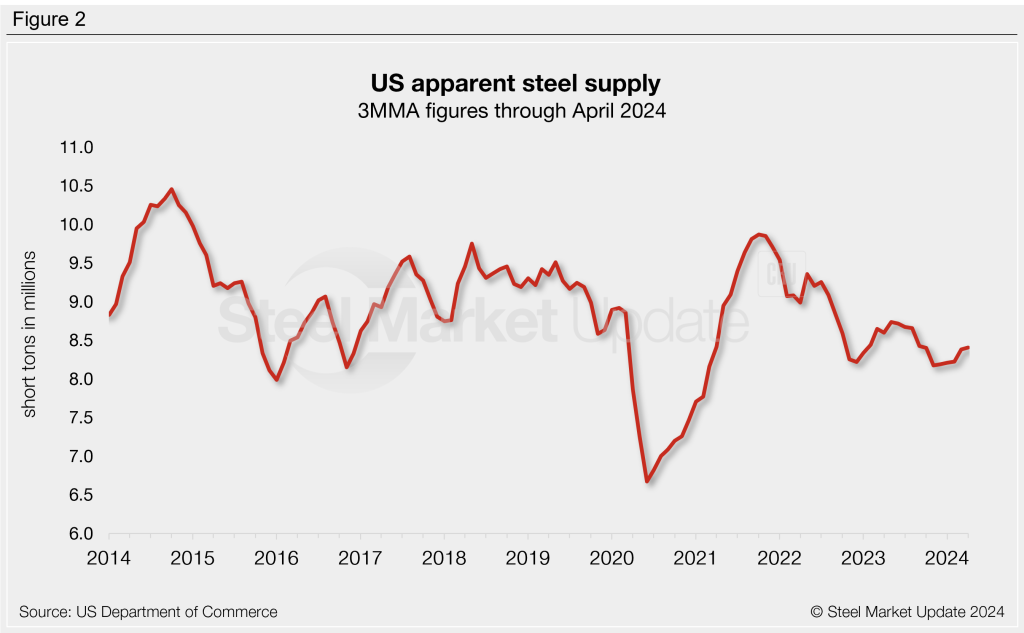
Calculating supply levels on a three-month moving average (3MMA) basis can smooth out the month-to-month variability to better highlight long-term trends. The 3MMA through April rose to a seven-month high of 8.40 million st. Compare this to the 2023 monthly supply average of 8.49 million st and the 2022 average of 8.83 million st. Overall, supply on a 3MMA basis has been trending downward since peaking in late 2021 at 9.87 million st.
Comparisons
Apparent supply in April was lower by 60,000 st or 1% than the same month one year ago when supply was at 8.69 million st. This small year-over-year (y/y) decline is primarily due to a 144,000-st (2%) reduction in domestic mill shipments and a 73,000-st (10%) rise in exports, negated mainly by a 157,000-st (8%) increase in finished imports.
Over the last four months, apparent supply has trended upwards, aside from February’s dip. In this time period, we have seen strengthening finished imports and exports and relatively stable domestic shipments (Figure 3).
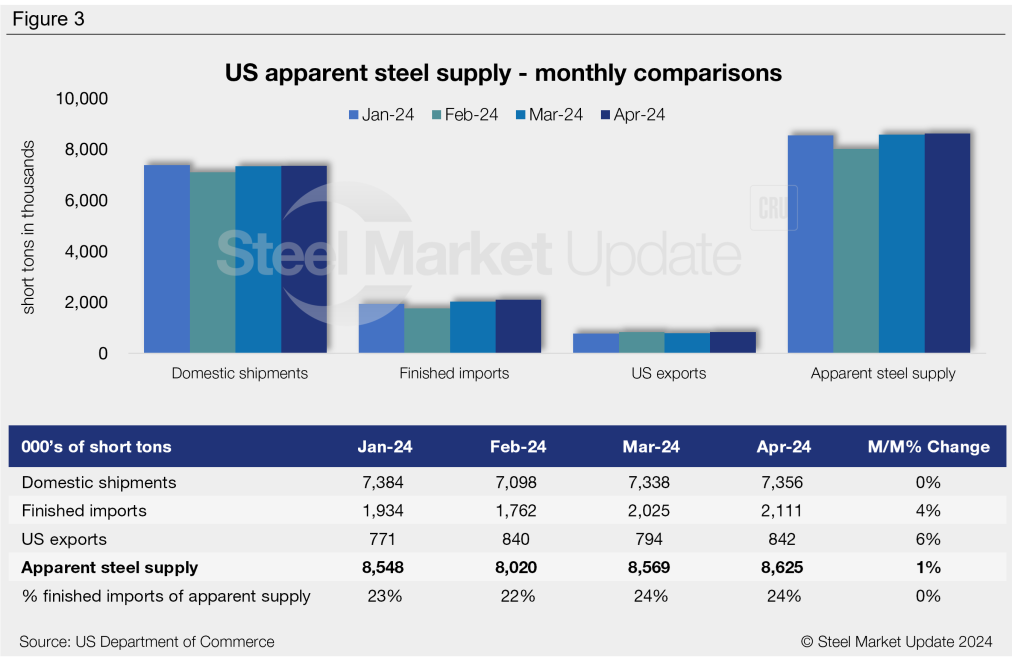
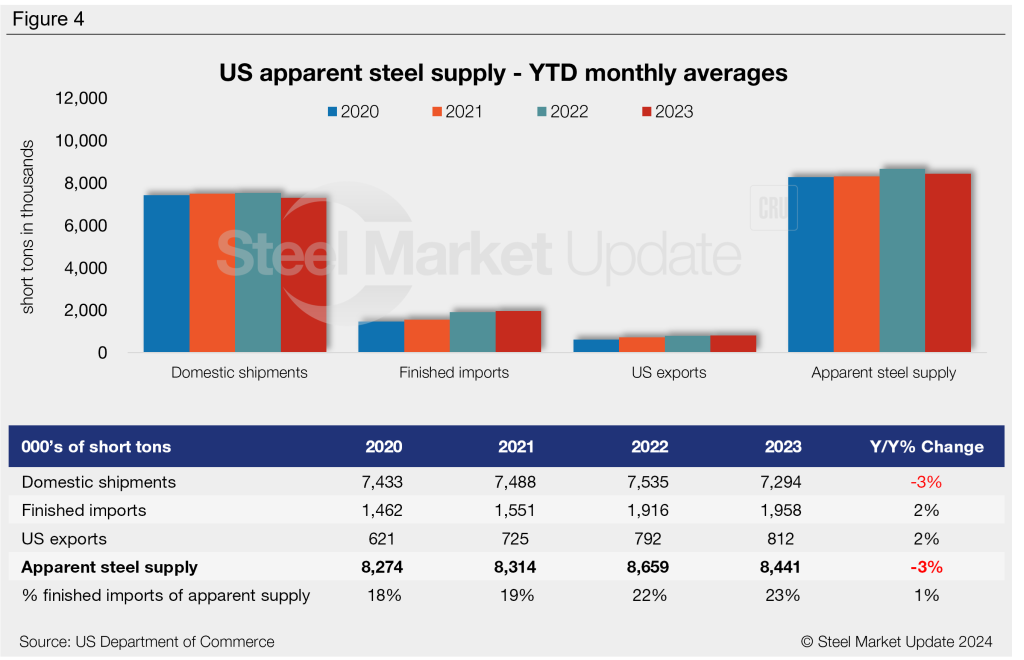
Figure 4 shows year-to-date (YTD) monthly averages for each statistic over the last four years. The average monthly supply level for the first four months of 2024 was up to 8.44 million st, 3% lower than the same period in 2023. The highest YTD monthly average in recent history was in 2022 at 8.66 million st.
To see an interactive graphic of our apparent steel supply history, click here. If you need assistance logging into or navigating the website, contact us at info@steelmarketupdate.com.


