Analysis
May 10, 2024
May energy market update
Written by Brett Linton
In this Premium analysis we cover North American oil and natural gas prices, drilling rig activity, and crude oil stock levels. Trends in energy prices and rig counts are an advanced indicator of demand for oil country tubular goods (OCTG), line pipe, and other steel products.
The Energy Information Administration (EIA) released its May Short-Term Energy Outlook (STEO) earlier this month, forecasting spot prices, production, and inventories for crude oil and natural gas. Crude oil prices are forecast to hold steady through the remainder of the year, while natural gas is expected to remain low due to excess inventory. You can view the latest EIA Short-Term Energy Outlook here.
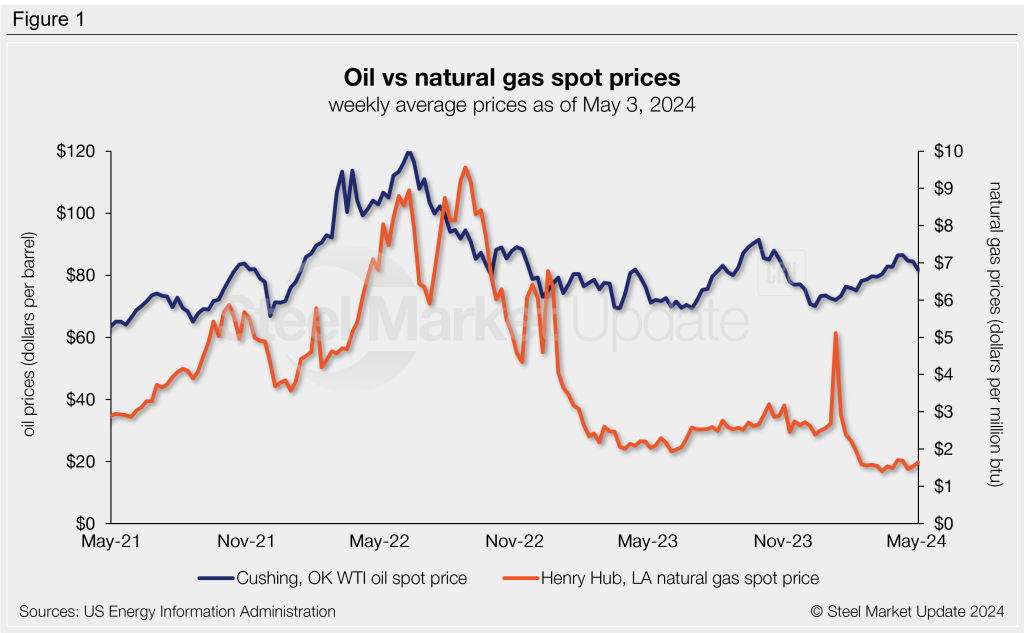
Oil and gas spot prices
The weekly West Texas Intermediate oil spot market price had been gradually recovering since December, but has ticked lower over the last few weeks. The spot price stands at $81.74 per barrel (b) as of the week ending May 3 (Figure 1). The EIA expects oil spot prices to average $90/b for the remainder of 2024, driven by ongoing geopolitical tensions and OPEC+ production cuts.
Their latest release details how excess capacity could buffer potential supply disruptions, commenting “crude oil price volatility has been subdued for much of this year by significant spare crude oil production capacity. If holders of spare production capacity choose to deploy it, supply can be available to the oil market in the event of any short-term supply disruption.”
Natural gas spot prices remain near historical lows, having fallen to a 25-year low in mid-March of $1.40 per metric million British thermal units (mmBtu). The EIA explains that natural gas storage levels are historically high due to surplus inventory levels from reduced winter consumption. The latest natural gas price has recovered slightly to $1.64/mmBtu as of last week. The May STEO forecasts natural gas production to ease as a result of low prices.
Rig counts
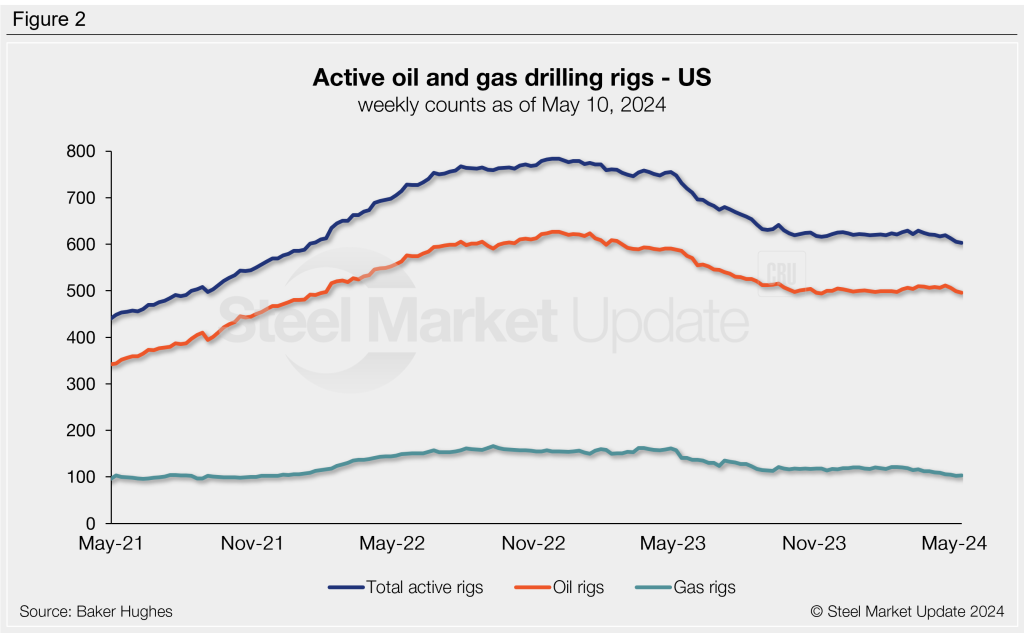
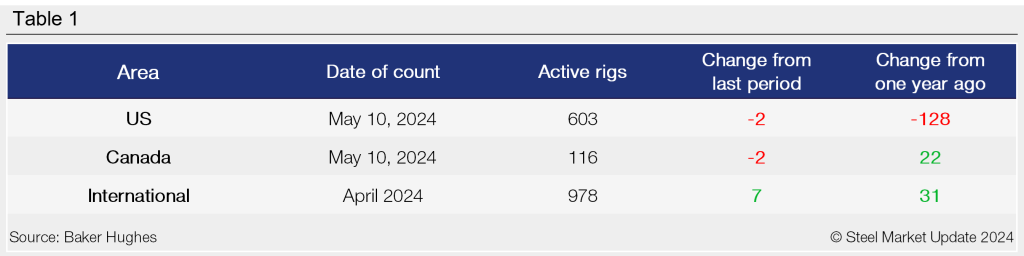
The number of active US oil and gas drill rigs has eased 2% over the past month, following a relatively stable period from October through March. The latest US count is down to 603 active drill rigs as of the end of this week according to Baker Hughes (Figure 2). This is now the lowest weekly count recorded since January 2022. Active rig counts are down 18% compared to levels one year prior.
Canadian rig activity continues to decline from annual highs, a seasonal trend experienced each spring as warmer weather sets in and thawing ground conditions limit access to roads and sites. Active Canadian rigs through this week total 116, up 23% compared to counts this time last year (Figure 3).
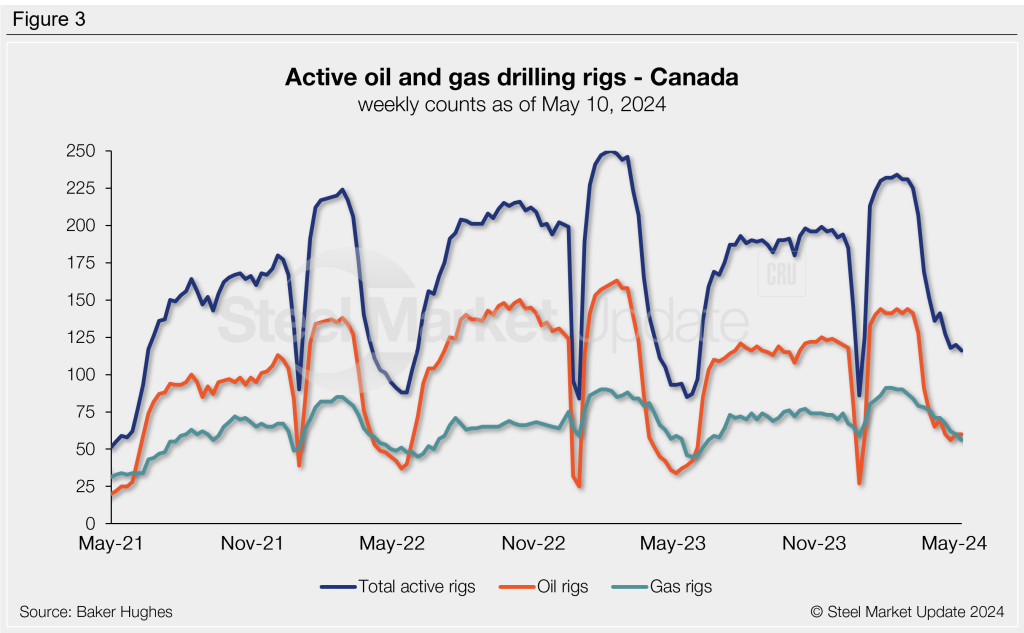
Table 1 below compares the current US, Canadian and international rig counts to historical levels.
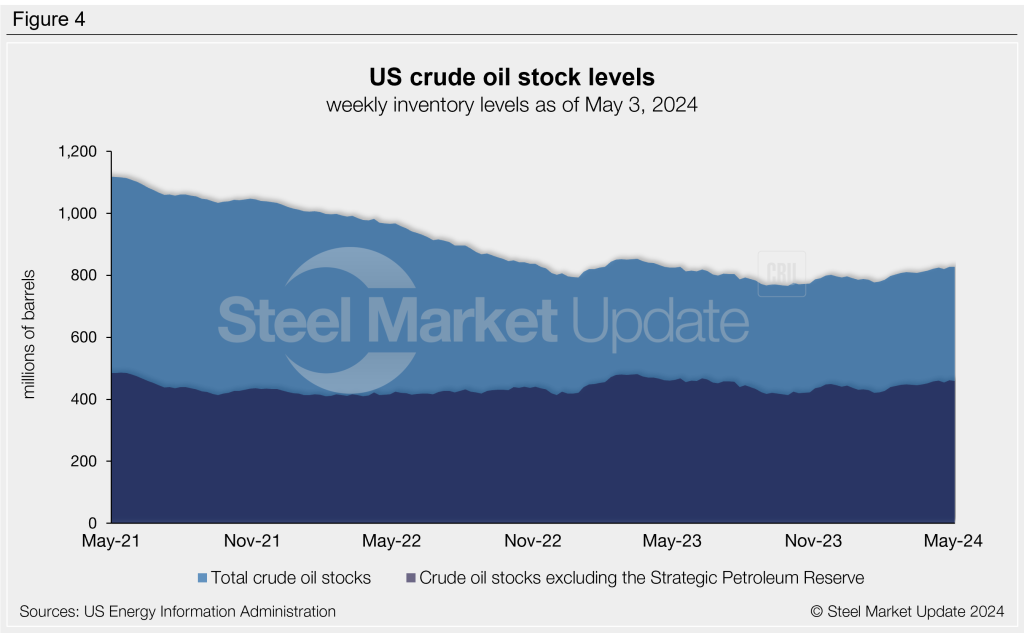
Stock levels
US crude oil stocks have slowly recovered since reaching a 38-year low last September (765 million barrels). Stock levels reached a one-year high barrels in the last week of April at 827 million barrels, holding steady through last week. May levels are 5% higher than the start of the year and in line with levels one year ago (Figure 4).