Analysis
April 18, 2024
April energy market update
Written by Brett Linton
In this Premium analysis we cover North American oil and natural gas prices, drilling rig activity, and crude oil stock levels.
The Energy Information Administration’s (EIA) April Short-Term Energy Outlook (STEO) was released earlier this month, forecasting spot prices, production, and inventories for crude oil and natural gas. Crude oil prices are forecast to rise slightly through the second quarter of this year, while natural gas prices are expected to remain historically low due to excess inventory. You can view the latest EIA Short-Term Energy Outlook here.
Oil and gas spot prices
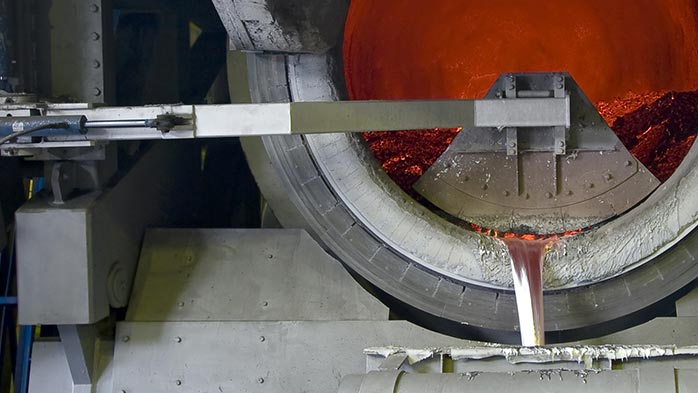
The weekly West Texas Intermediate oil spot market price continues to inch up, now at $86.50 per barrel (b) as of the week ending April 12 (Figure 1). Oil spot prices have been gradually recovering since December. The EIA expects oil spot prices to average $90/b in the second quarter of 2024 (up $2 from their March estimate and up $6 from February), attributing this higher forecast to strengthening oil inventory draws globally and ongoing geopolitical risks.
Natural gas spot prices remain near historical lows, having fallen to a 25-year low in mid-March of $1.40 per metric million British thermal units (mmBtu). The EIA explains that natural gas storage levels are historically high due to surplus inventory levels from reduced winter consumption. The latest natural gas price has recovered slightly to $1.69/mmBtu as of last week. The April STEO forecasts natural gas prices to remain below $2.00/mmBtu through the second quarter and slightly increase into Q3. Their release comments, “Despite lower production, we still expect the United States will have the most natural gas in storage on record when the winter withdrawal season begins in November.”
Rig counts
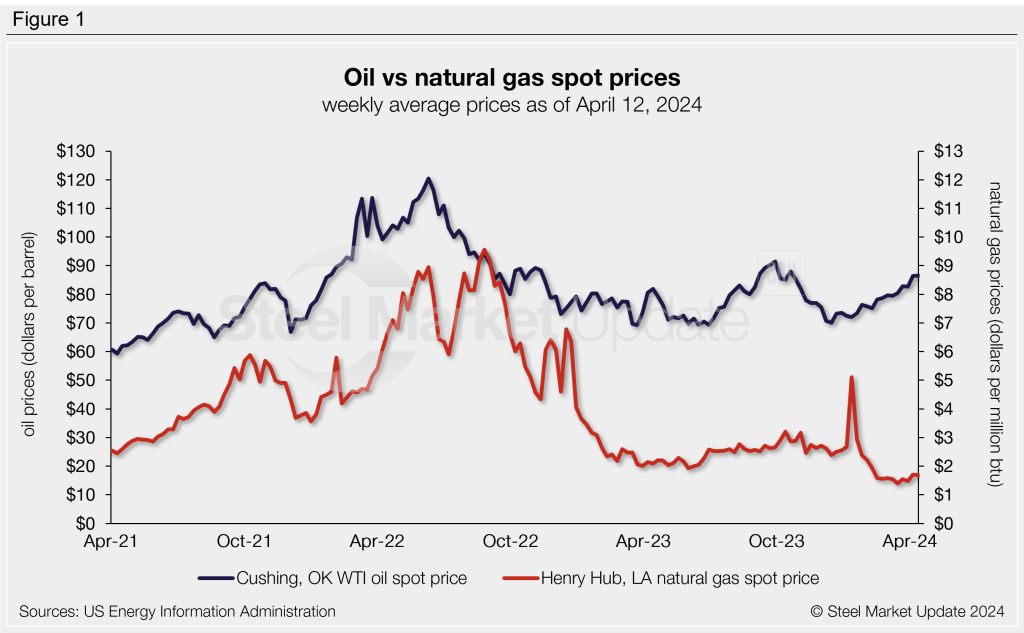
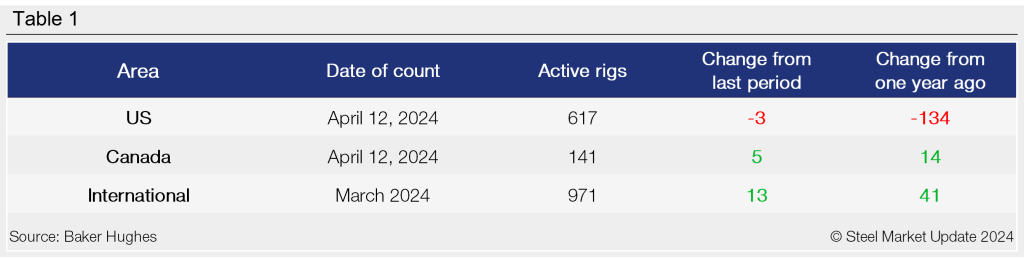
The number of active US oil and gas drill rigs has remained relatively stable over the past six months. The latest US count was 617 active drill rigs as of the end of this week, consisting of 506 oil rigs, 109 gas rigs, and two miscellaneous rigs, according to Baker Hughes (Figure 2). Active rig counts are down 18% compared to levels one year prior.
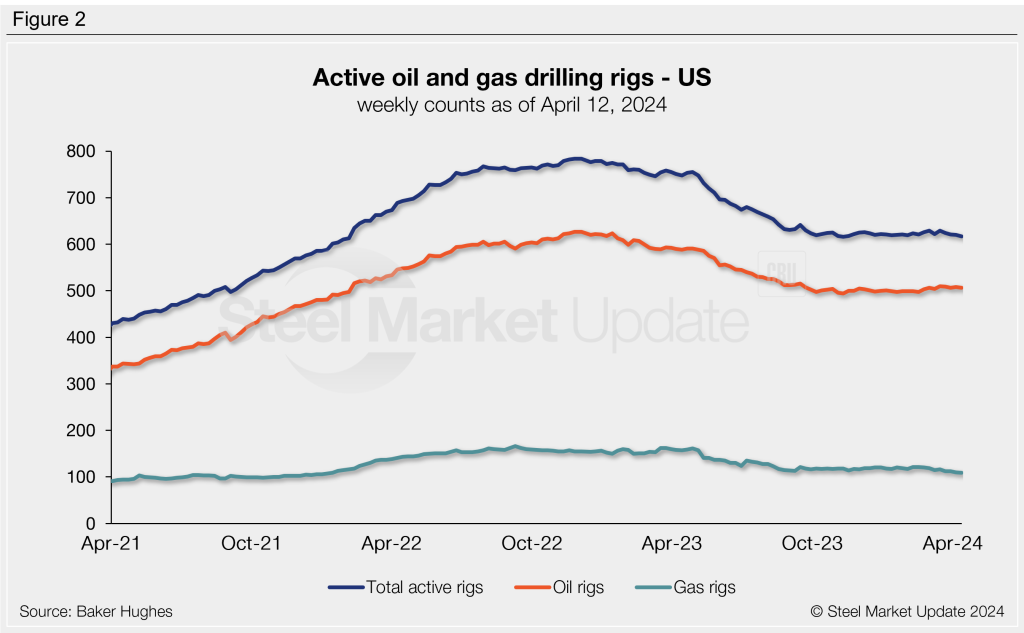
The latest Canadian rig count is 141 rigs, consisting of 70 oil rigs and 71 gas rigs. Canadian rig activity is beginning to decline from annual highs, a seasonal trend experienced each spring as warmer weather sets in and thawing ground conditions limit access to roads and sites. Active Canadian rigs are up 11% compared to activity this time last year (Figure 3).
Table 1 below compares the current US, Canadian, and international rig counts to historical levels.
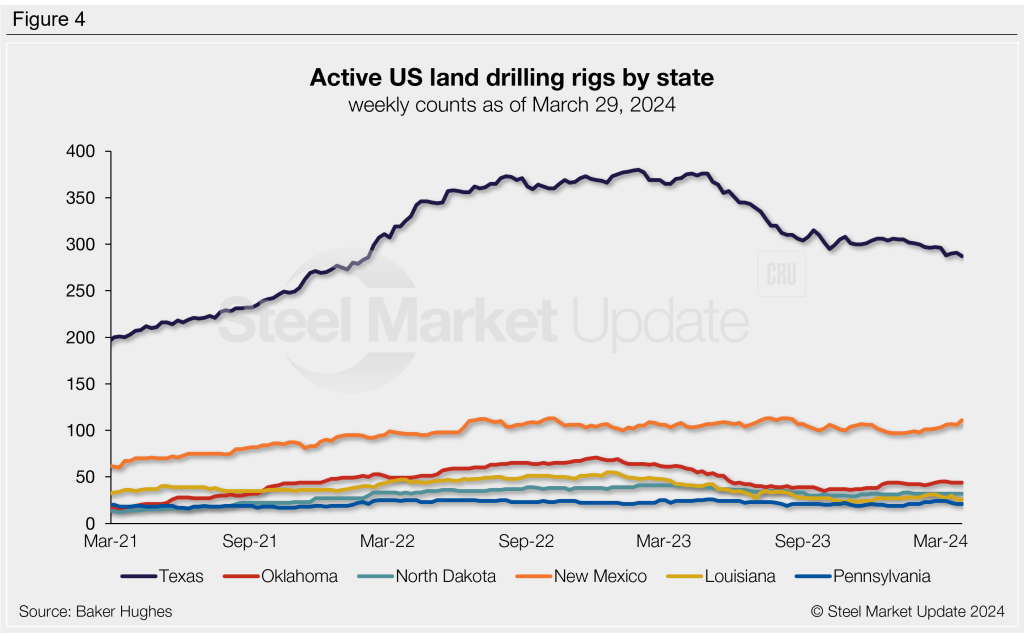
US oil and gas production is heavily concentrated in Texas, Oklahoma, North Dakota, and New Mexico. Through the end of March, Texas is the most active state with 287 rigs in operation and New Mexico is the second highest with 111 rigs (Figure 4). The percentage of land drilling activity represented by each state has seen little variance over the past year; almost half of all drilling activity occurs in Texas, followed by 18% in New Mexico, 7% in Oklahoma, and 3-5% in Louisiana, North Dakota, and Pennsylvania.
Stock levels
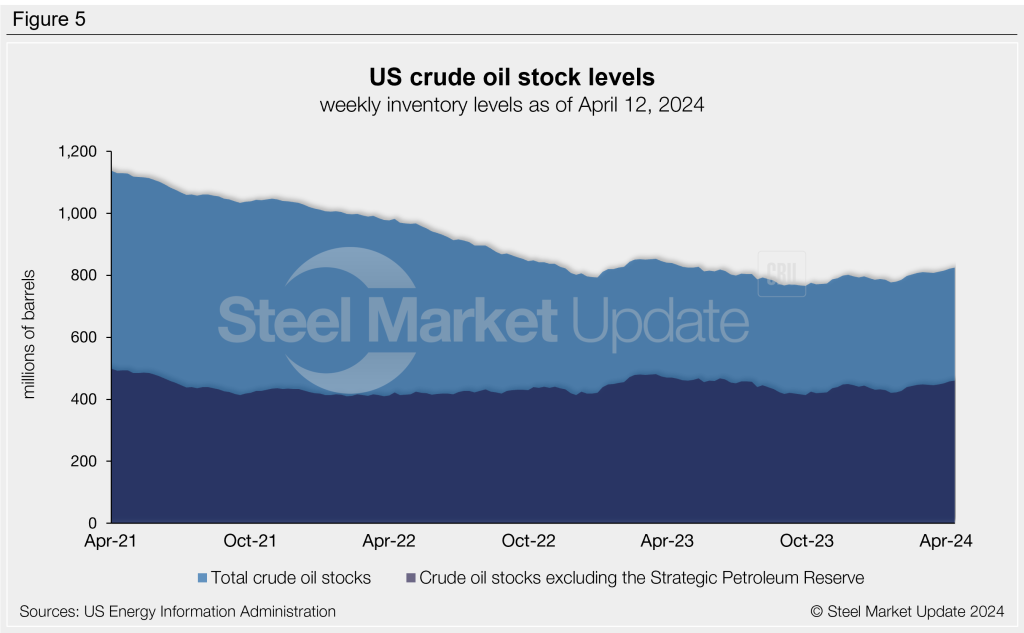
US crude oil stocks remain low compared to the 2020 highs, having reached a 38-year low of 765 million barrels last September. Stock levels have slowly recovered since then, rising to an 11-month high of 825 million barrels last week. April levels are 5% higher than the start of this year but 1% less than levels one year ago (Figure 5).
Trends in energy prices and rig counts are an advanced indicator of demand for oil country tubular goods (OCTG), line pipe and other steel products.