

Market Data
April 9, 2024
Apparent steel supply slips in February
Written by Brett Linton
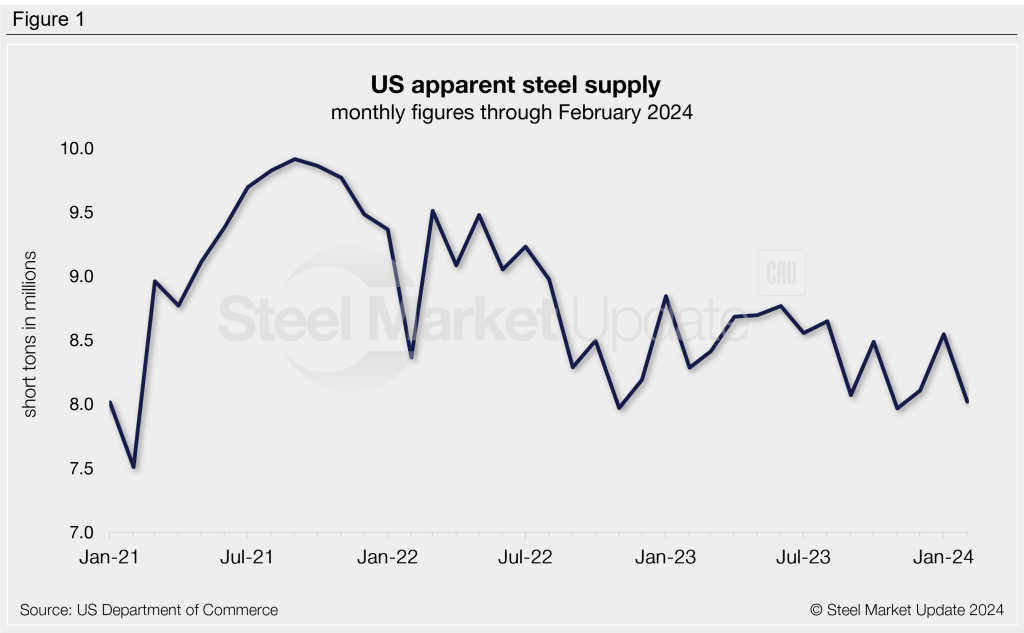
The apparent supply of steel in the US fell 6% from January to February, according to data compiled from the US Department of Commerce and the American Iron and Steel Institute (AISI). Following the five-month high seen the month prior, apparent supply eased to 8.02 million short tons (st) in February, the third lowest monthly rate seen in the last three years.
Apparent steel supply is calculated by combining domestic steel mill shipments and finished US steel imports, then deducting total US steel exports.
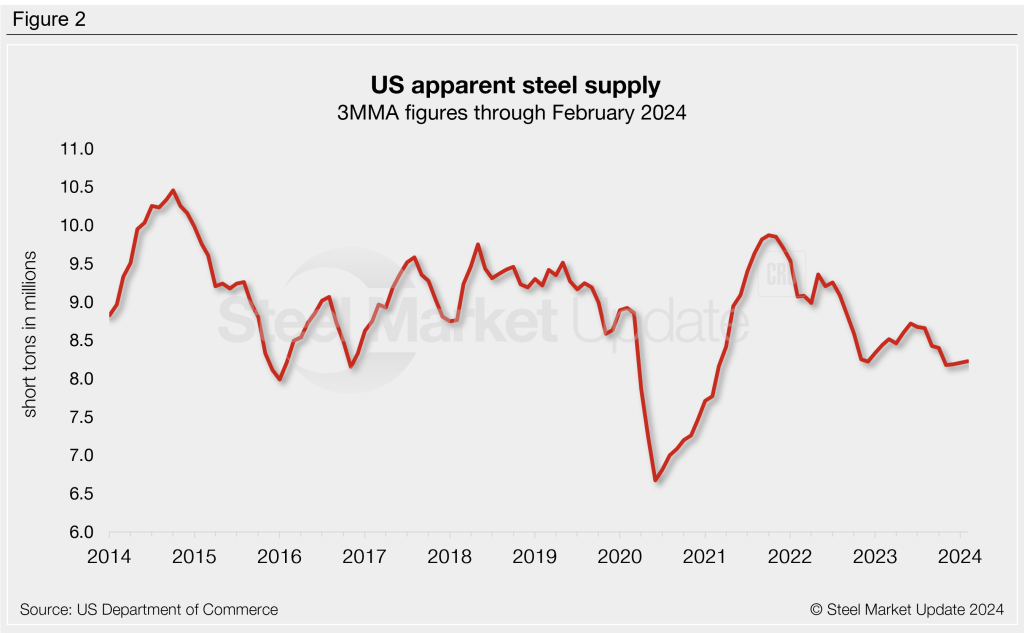
Three-month moving average
Calculating supply levels on a three-month moving average (3MMA) basis can smooth out the month-to-month variability. The 3MMA through February eased to 8.23 million st. The 3MMA has been trending downward overall since peaking in late 2021 at 9.87 million st.
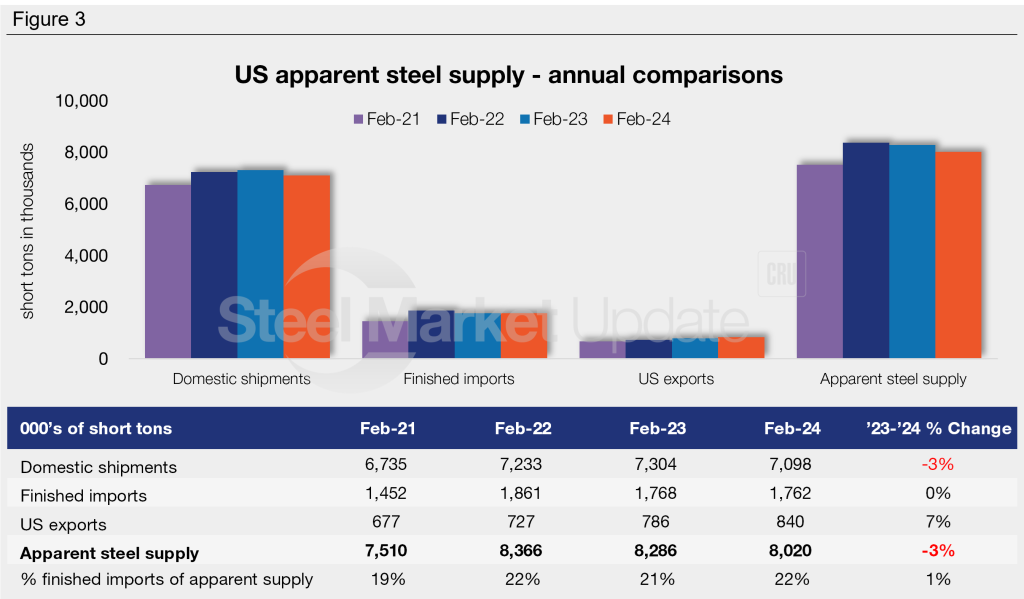
Comparisons
Apparent supply in February was 3% lower than the same month one year ago when the supply was 8.29 million st. This decline is primarily due to a decline in domestic mill shipments. Figure 3 shows a year-over-year (y/y) comparison for the month of February across the last four years.
Looking across the last four months, apparent supply had eased to a nine-month low in November, increased in December and January, then slipped in February (Figure 4). The decline in February was mostly attributed to a decline in domestic shipments, followed by a reduction in finished imports.
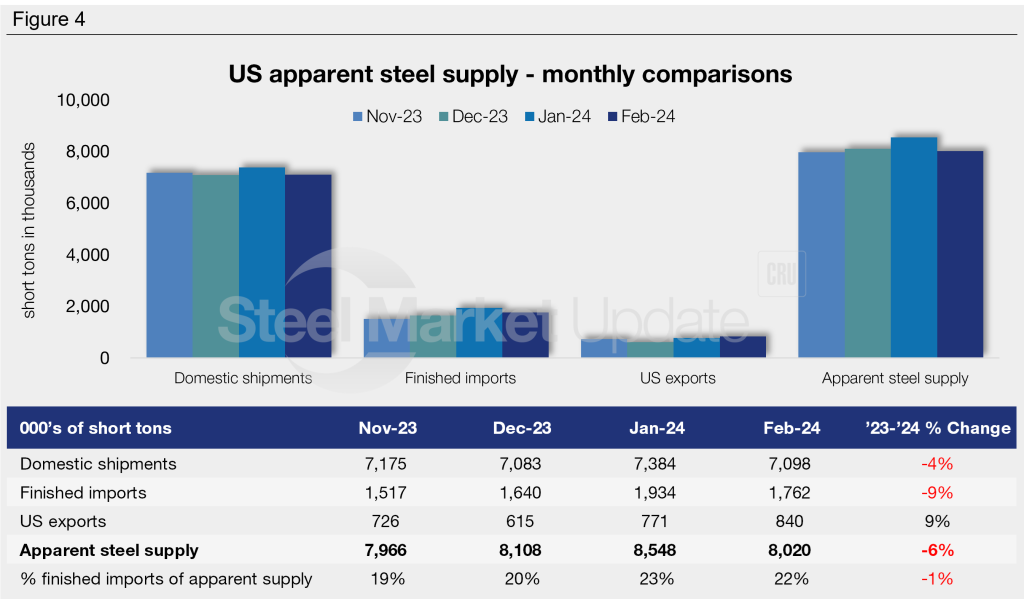
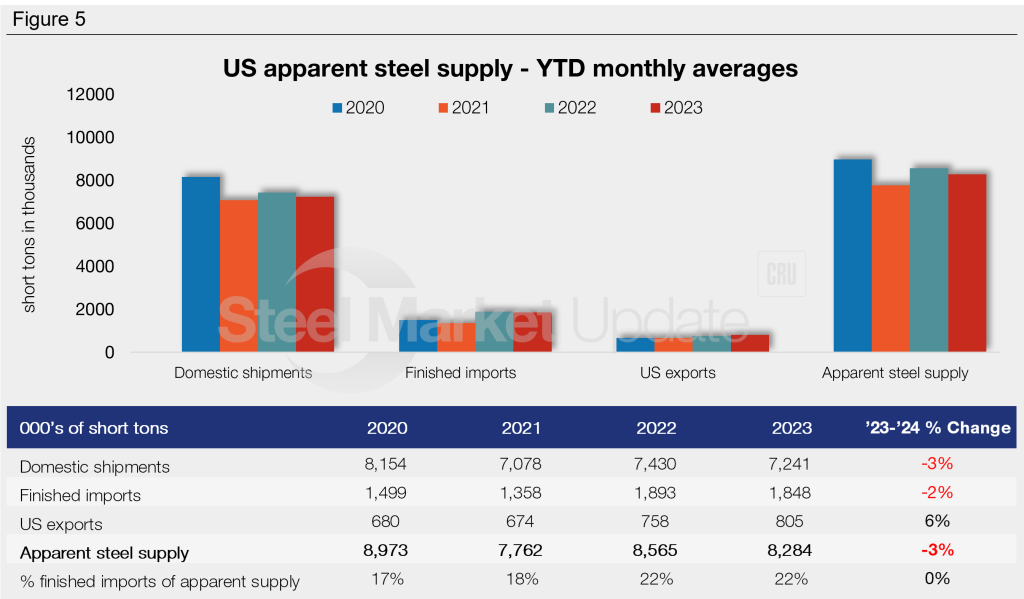
Figure 5 shows year-to-date (YTD) monthly averages for each statistic over the last four years. The average monthly supply level for the first two months of 2024 is up to 8.28 million st, 3% lower than the same period last year. 2020 holds the highest year-to-date (YTD) monthly average in our recent history at 8.97 million st.
To see an interactive graphic of our apparent steel supply history, click here. If you need any assistance logging into or navigating the website, contact us at info@steelmarketupdate.com.


