

Market Data

April 2, 2024
SMU price ranges: Sheet picks up steam, plate little changed
Written by Brett Linton
Sheet prices moved higher this week for the second consecutive week, while plate prices ticked lower, according to our latest canvas of the steel market.
SMU’s average hot-rolled (HR) coil price increased by $35 per short ton (st) from last week to $845/st and is now at the highest level seen since late February.
Cold-rolled (CR) and galvanized sheet prices both rose $25/st w/w to stand at $1,140/st and $1,145/st respectively. Like HR, the last time we saw prices this high was back in February.
Galvalume prices were flat from last week, holding steady at $1,150/st.
Plate prices eased $10/st w/w to $1,250/st this week. Plate prices have been sliding lower throughout the year, with this week’s price nearing a three-year low.
SMU’s sheet price momentum indicators have been revised this week from neutral to higher. We expect sheet prices to move upwards from here. Our plate price momentum indicator remains at neutral.
Hot-rolled coil
The SMU price range is $790-900/st, with an average of $845/st FOB mill, east of the Rockies. The lower end of our range increased $10/st w/w and the top end rose $60/st. Our overall average is up $35/st compared to last week. Our price momentum indicator for HR is now at higher, meaning we expect prices to move upwards over the next 30 days.
Hot rolled lead times range from 3-9 weeks, averaging 5.36 weeks as of our March 28 market survey.
Cold-rolled coil
The SMU price range is $1,100–1,180/st, with an average of $1,140/st FOB mill, east of the Rockies. The lower end of our range is $50/st higher w/w, while the top end remained unchanged. Our overall average is up $25/st from the previous week. Our price momentum indicator for CR is now at higher, meaning we expect prices to move upwards over the next 30 days.
Cold rolled lead times range from 6-12 weeks, averaging 7.84 weeks through our latest survey.
Galvanized coil
The SMU price range is $1,090–1,200/st, with an average of $1,145/st FOB mill, east of the Rockies. The lower end of our range is $20/st higher w/w, while the top of our range rose $30/st. Our overall average is $25/st higher than last week. Our price momentum indicator for galvanized is now at higher, meaning we expect prices to move upwards over the next 30 days.
Galvanized .060” G90 benchmark: SMU price range is $1,187–1,297/st with an average of $1,242/st FOB mill, east of the Rockies.
Galvanized lead times range from 6-11 weeks, averaging 7.63 weeks through our latest survey.
Galvalume coil
The SMU price range is $1,100–1,200/st, with an average of $1,150/st FOB mill, east of the Rockies. The lower end of our range declined $20/st w/w, while the top end increased $20/st. Our overall average is unchanged compared to the previous week. Our price momentum indicator for Galvalume is now at higher, meaning we expect prices to move upwards over the next 30 days.
Galvalume .0142” AZ50, grade 80 benchmark: SMU price range is $1,394–1,494/st with an average of $1,444/st FOB mill, east of the Rockies.
Galvalume lead times range from 6-12 weeks, averaging 8.25 weeks through our latest survey.
Plate
The SMU price range is $1,200–1,300/st, with an average of $1,250/st FOB mill. The lower end of our range declined $20/st w/w, while the top end remained unchanged. Our overall average declined $10/st compared to the previous week. Our price momentum indicator for plate remains at neutral, meaning we expect prices to remain relatively stable over the next 30 days.
Plate lead times range from 4-7 weeks, averaging 5.67 weeks through our latest survey.
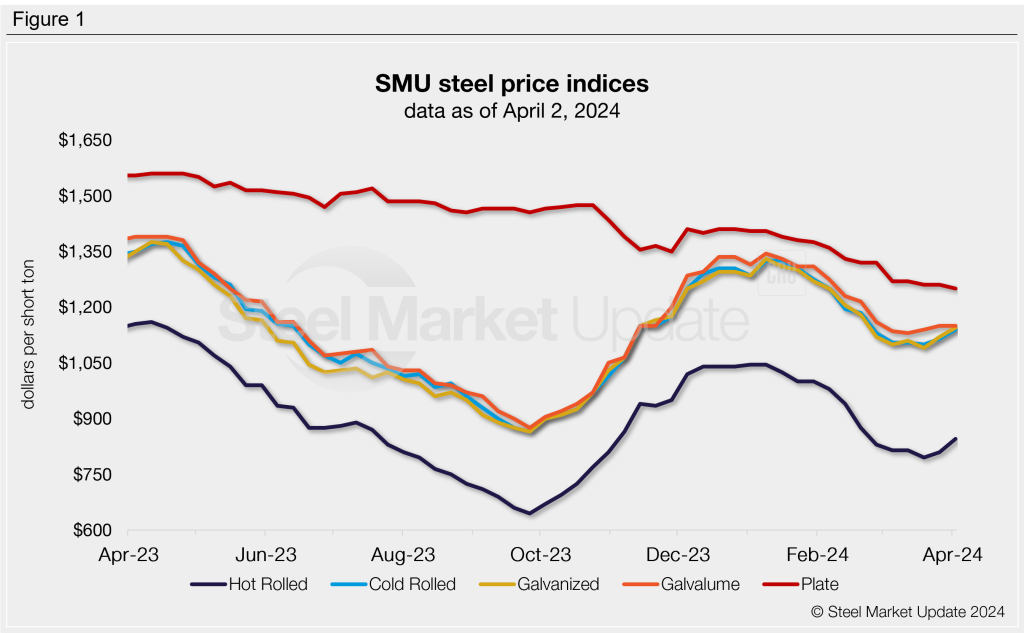
SMU note: Above is a graphic showing our hot rolled, cold rolled, galvanized, Galvalume, and plate price history. This data is also available here on our website with our interactive pricing tool. If you need help navigating the website or need to know your login information, contact us at info@steelmarketupdate.com.


