

Market Data
March 15, 2024
March energy market update
Written by Brett Linton
In this Premium analysis we cover North American oil and natural gas prices, drilling rig activity, and crude oil stock levels.
The Energy Information Administration’s (EIA) March Short-Term Energy Outlook (STEO) was released earlier this week, forecasting spot prices, production, and inventories for crude oil and natural gas. Crude oil prices are forecast to rise slightly through the second quarter of this year, while natural gas prices are expected to remain historically low. You can view the latest EIA Short-Term Energy Outlook here.
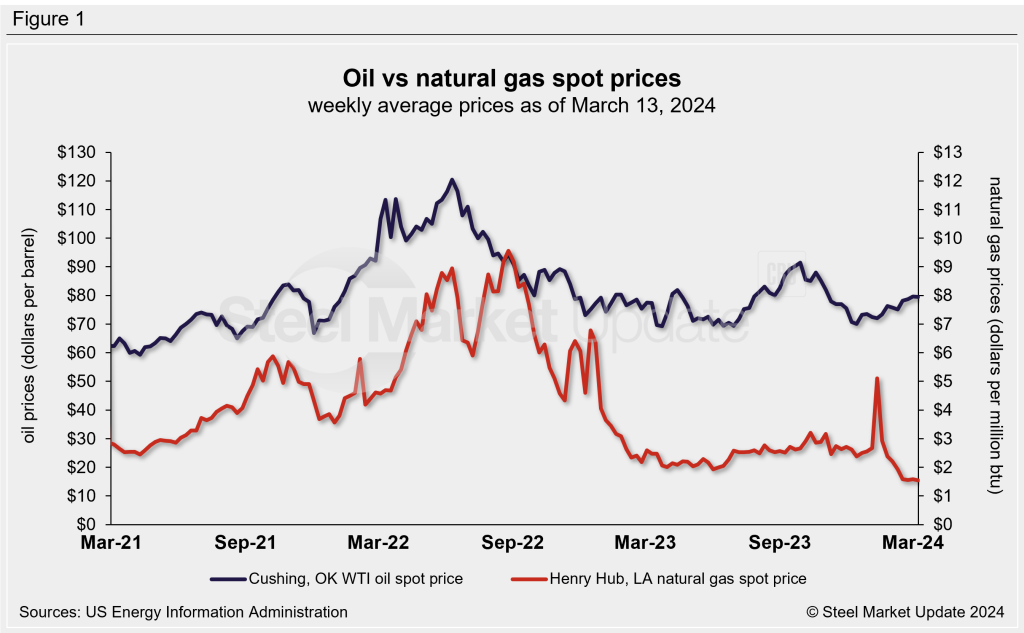
Oil and gas spot prices
The weekly West Texas Intermediate oil spot market price held steady at $79.53 per barrel as of the week ending March 8 (Figure 1). Oil spot prices have been gradually recovering since December. The EIA expects oil spot prices to average $88/b in the second quarter of 2024 (up $4 from the February estimate), attributing this higher forecast to reduced production due to OPEC+ cuts.
Natural gas spot prices remain near historical lows, falling to a 3.5-year low last week of $1.55 per metric million British thermal units (mmBtu). The EIA notes that this is a record low price when adjusted for inflation. The March STEO forecasts natural gas prices to remain below $2.00/mmBtu through the second quarter, due to surplus inventory levels from reduced winter consumption.
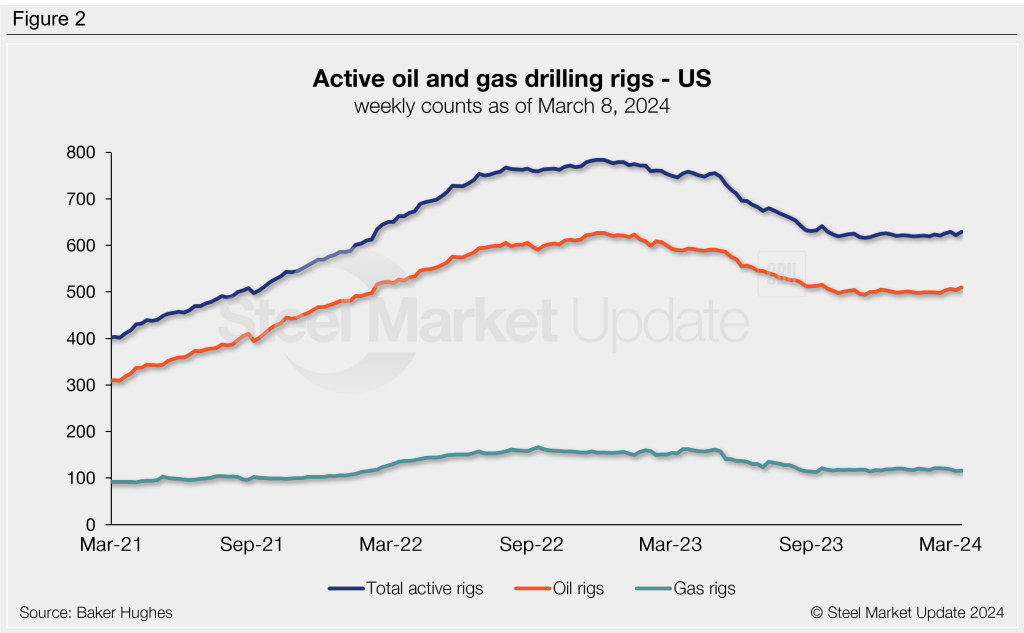
Rig counts
The number of active US oil and gas drill rigs has remained relatively stable over the past five months. The latest US count was 629 active drill rigs as of the end of this week, made up of of 510 oil rigs, 116 gas rigs, and three miscellaneous rigs, according to Baker Hughes (Figure 2). Active rig counts are down 25% compared to levels one year prior.
The latest Canadian rig count is 207 rigs, made up of 128 oil rigs and 79 gas rigs. Canadian rig activity is beginning to decline from annual highs, a seasonal trend experienced each March. Active Canadian rigs are unchanged compared to activity this time last year (Figure 3).
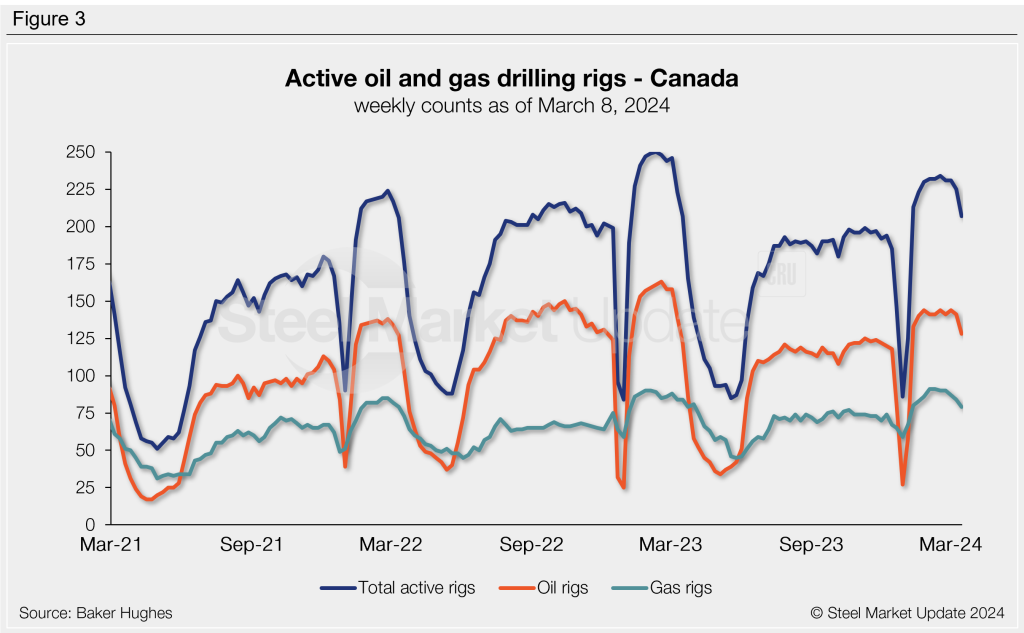
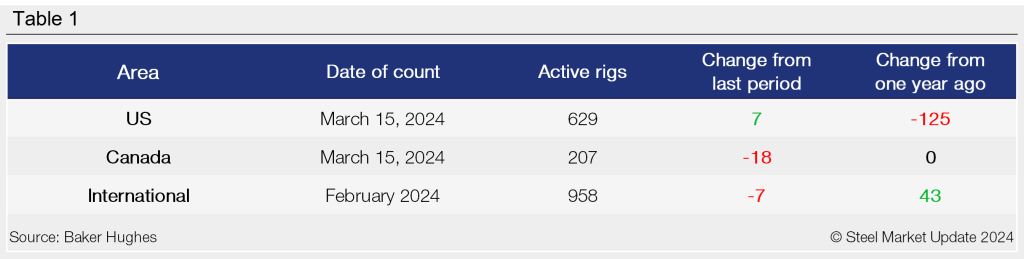
Table 1 below compares the current US, Canadian and international rig counts to historical levels.
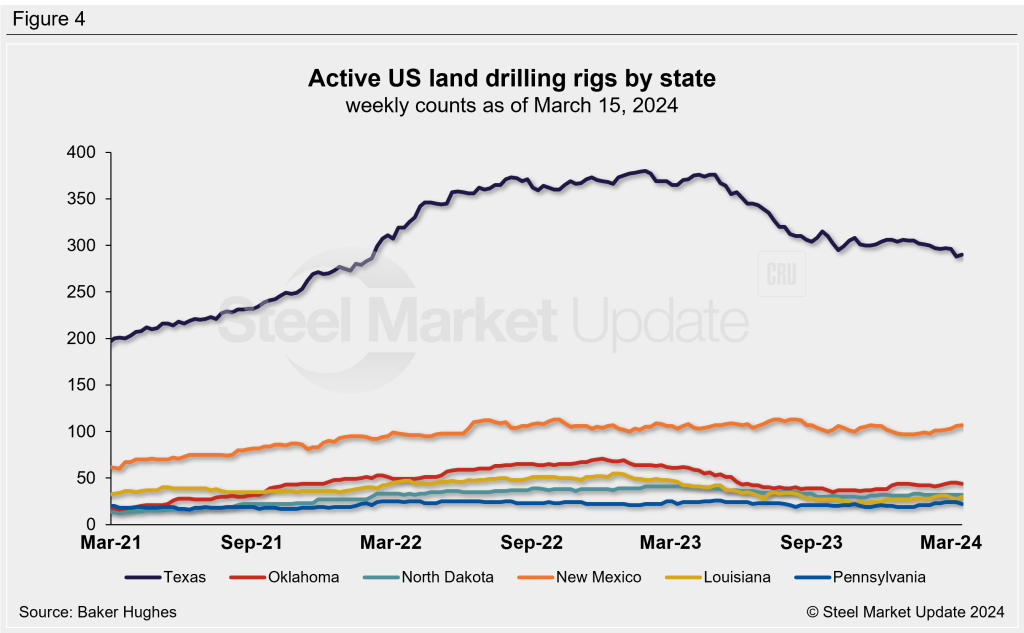
US oil and gas production is heavily concentrated in Texas, Oklahoma, North Dakota, and New Mexico. As of March 15, Texas is the most active state with 290 rigs in operation and New Mexico is the second highest with 107 rigs (Figure 4). The percentage of land drilling activity represented by each state has seen little variance over the past year; roughly half of all drilling activity continues to occur in Texas, followed by 18% in New Mexico, 7% in Oklahoma, and 4-5% in Louisiana, North Dakota, and Pennsylvania.
Stock levels
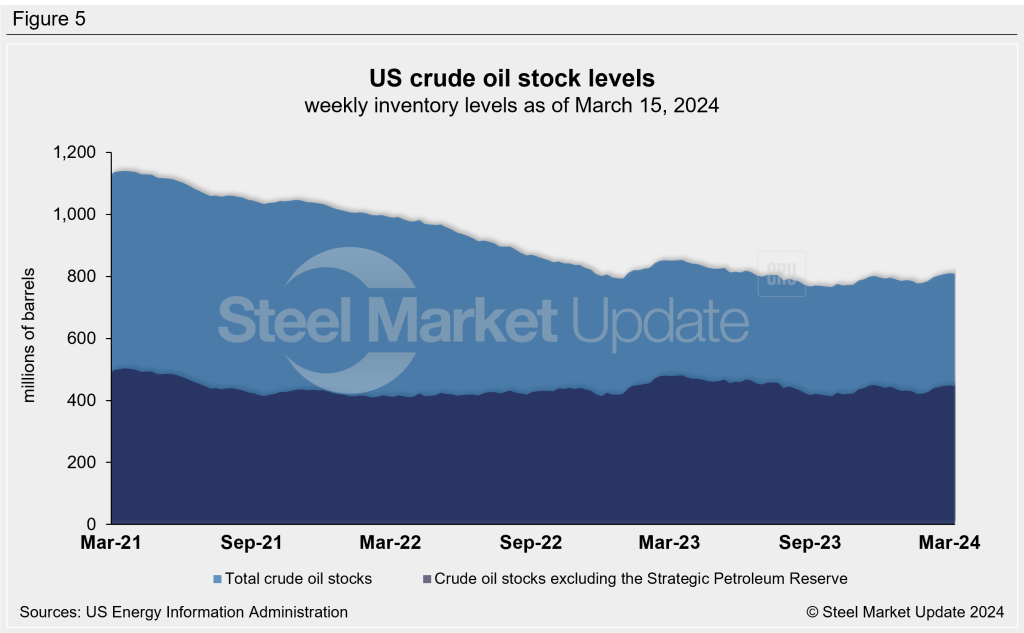
US crude oil stocks continue to decline from 2020 highs, having reached a 38-year low of 765 million barrels last September. Stock levels have begun to recover since then, rising to 809 million barrels last week. March levels are 3% higher than the start of this year but 5% less than levels one year ago (Figure 5).
Trends in energy prices and rig counts are an advanced indicator of demand for oil country tubular goods (OCTG), line pipe and other steel products.


