Market Data
March 14, 2024
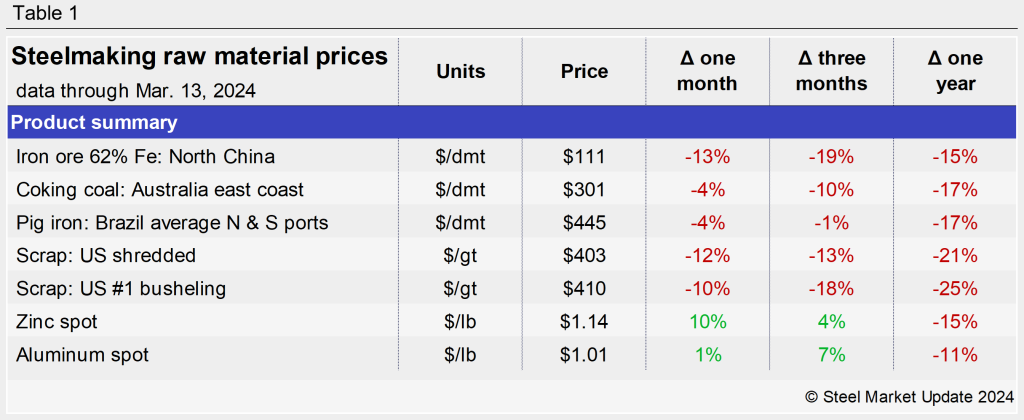
Steelmaking raw material prices ease into March
Written by Brett Linton
Editor’s note: Steel Market Update is pleased to share this Premium content with Executive members. For information on how to upgrade to a Premium-level subscription, contact Luis Corona at luis.corona@crugroup.com.
Prices of most steelmaking raw materials have moved lower over the last 30 days, according to Steel Market Update’s latest analysis.
Through March 13 data, prices for iron ore, coking coal, pig iron and steel scrap all saw declines month on month (m/m). Meanwhile, aluminum prices held steady and zinc prices saw a significant recovery. Compared to levels three months earlier, dynamics were similar for each product. Looking back to this time last year, prices for all seven raw material prices have seen double-digit declines across the last 12 months, some moving as much as 25% lower.
The below table summarizes the price changes of the seven materials considered in this analysis. It reports the percentage change from one month, three months, and one year prior for each product.
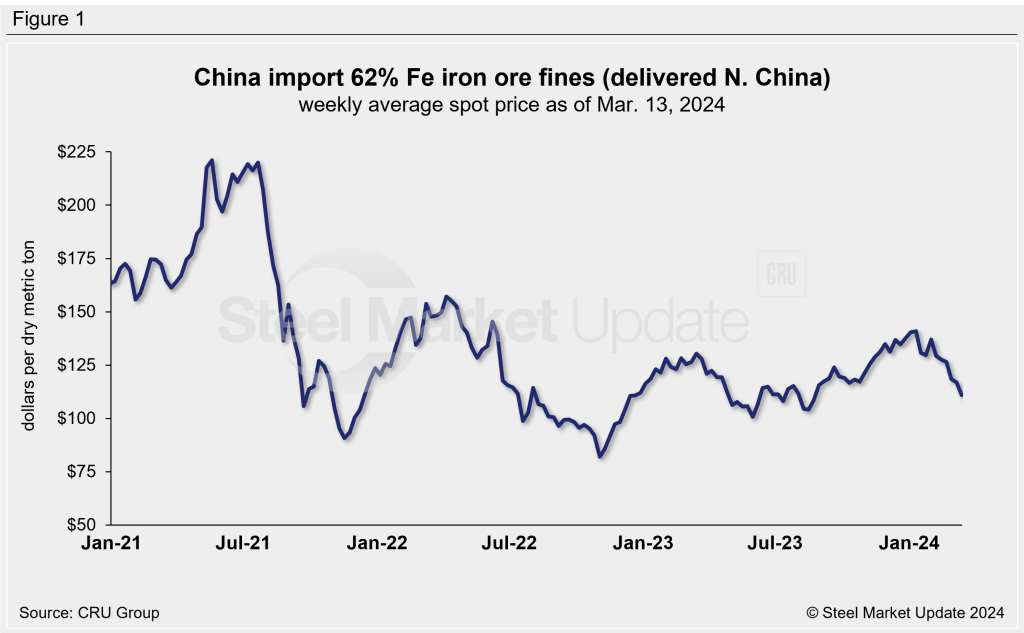
Iron ore
The import price of 62% Fe Chinese iron ore fines has been easing throughout the year, having reached a 19-month high in early-January. Figure 1 shows the price of 62% Fe delivered North China, currently at $111/dry metric ton (dmt) through March 13. Prices are 15% lower than levels seen this time last year.
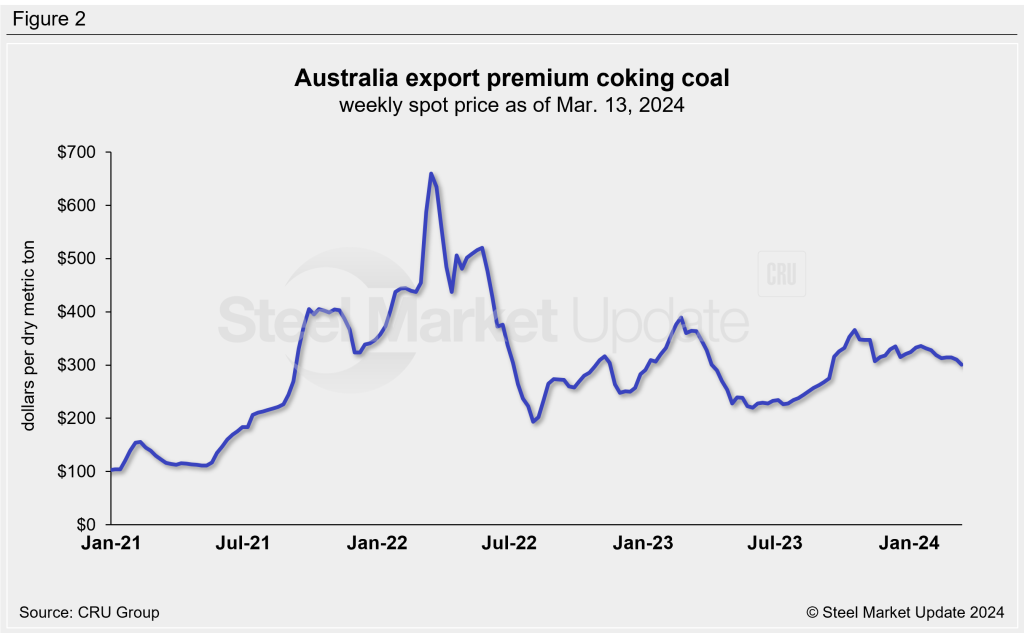
Coking coal
Like iron ore prices, premium hard coking coal prices have gradually eased over the last four months. The latest weekly price is $301/dmt as of March 13, down 4% over the last month and down 10% from prices three months prior (Figure 2). Prices are down 17% compared to tags one year ago.
Pig iron
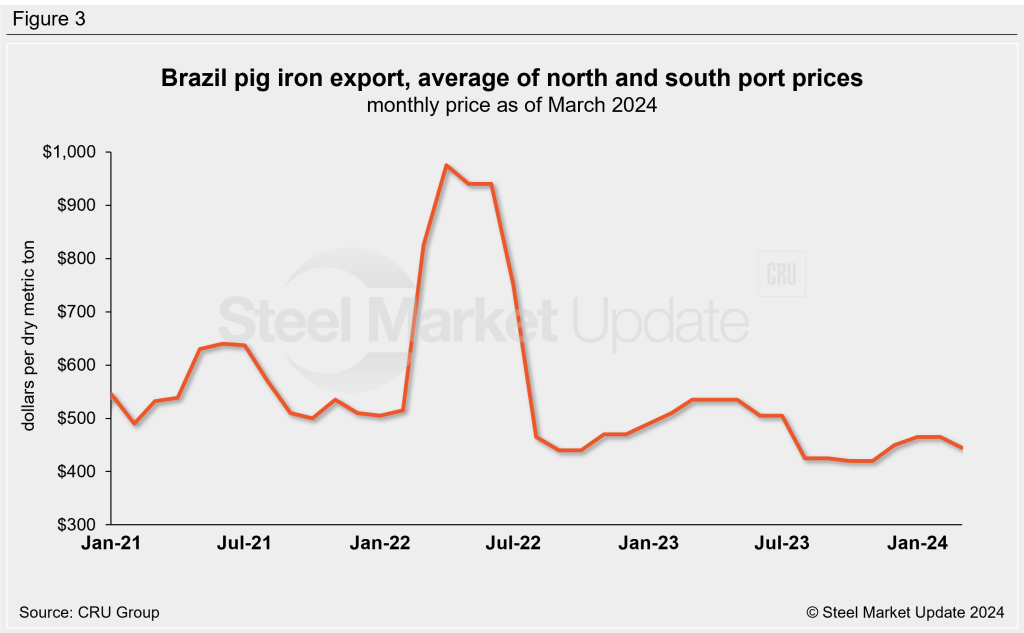
Most of the pig iron imported to the US had come from Russia, Ukraine, and Brazil. This report summarizes prices out of Brazil and averages the FOB value from the north and south ports.
Prior to this month, pig iron prices had risen since December to reach $465/dmt. March figures eased 4% to $445/data, now 17% lower than levels seen this time last year. Recall that pig iron prices had jumped more than 60% in April 2022 following the invasion of Ukraine by Russian forces, reaching a historic high of $975/dmt (Figure 3).
Scrap
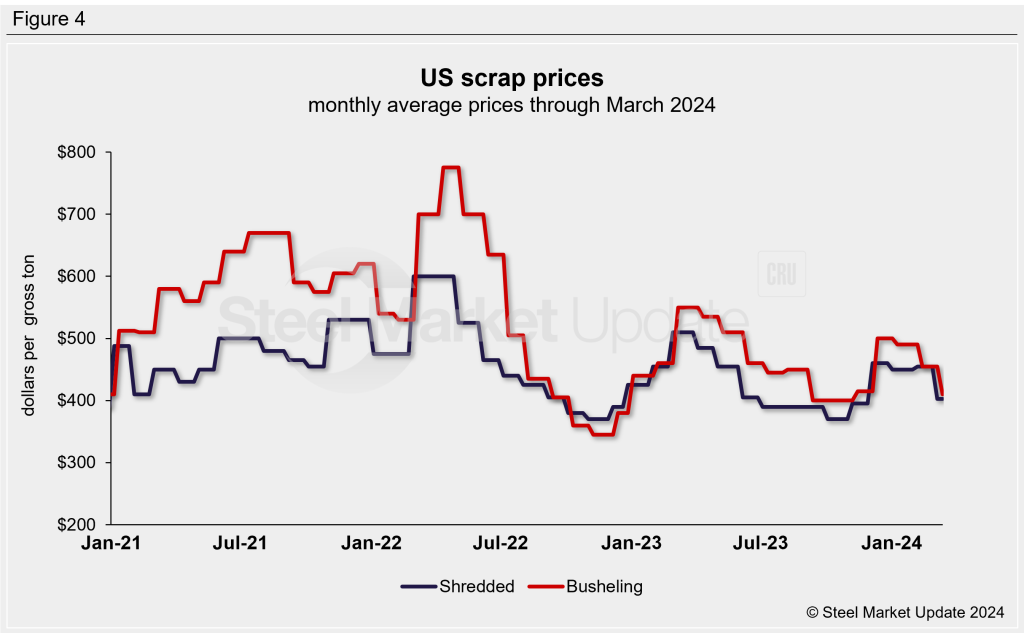
Steel scrap tags have trended downwards since peaking in December. In our Tuesday issue, SMU published scrap price indices through March. Shredded scrap slipped $53/gross ton (gt) from February, while busheling declined $45/gt. Scrap prices are down $55-90/gt compared to the December highs and are nearing recent lows. Figure 4 shows the spread between shredded and busheling scrap, priced in dollars per gross ton in the Great Lakes region.
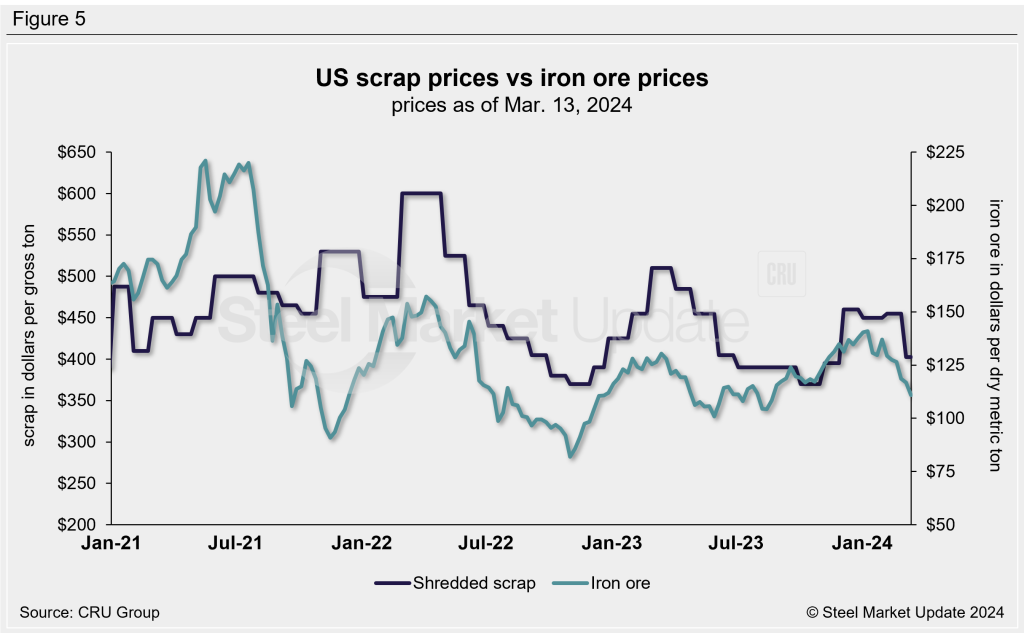
Changes in the relationship between scrap and iron ore prices offer insights into the competitiveness of integrated mills, whose primary feedstock is iron ore, compared to minimills, whose primary feedstock is scrap. Figure 5 shows the prices of mill raw materials over the past three years. Both iron ore and shredded scrap prices are 12-13% below levels one month ago, and similarly (41%) less than prices this time last year.
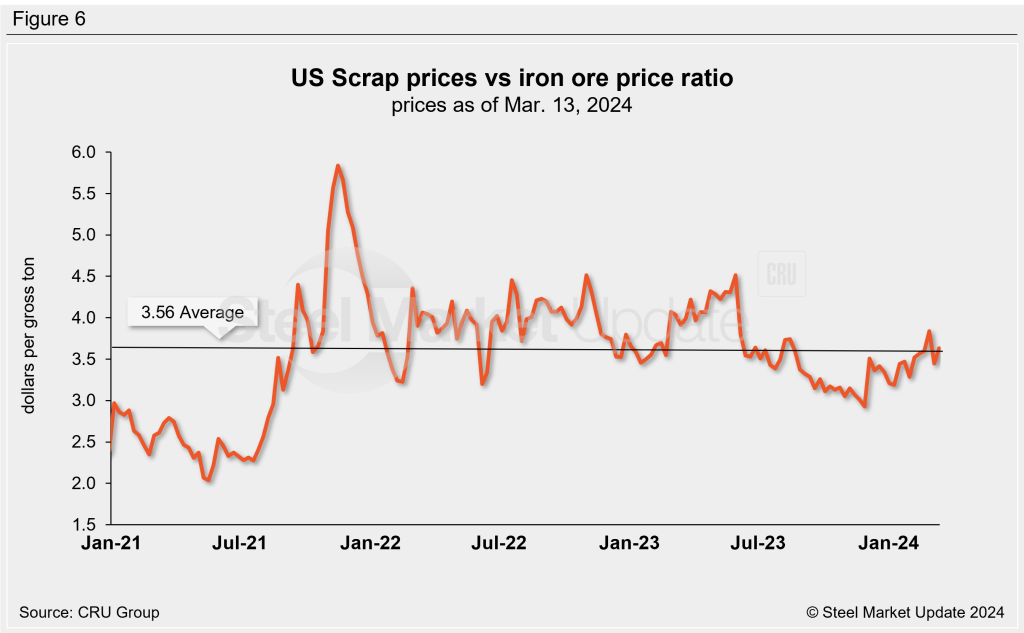
To compare these two feedstock materials, SMU divides the shredded scrap price by the iron ore price to calculate a ratio (Figure 6). A high ratio favors the integrated/blast furnace producers and a lower ratio favors the mini-mill/electric-arc furnace (EAF) producers. Integrated producers had mostly held the cost advantage from late-2021 through mid-2023. The advantage then briefly shifted to EAF producers in the second half of 2023, but has since edged back up to neutral ground. The ratio is up to 3.62 as of Mar. 13.
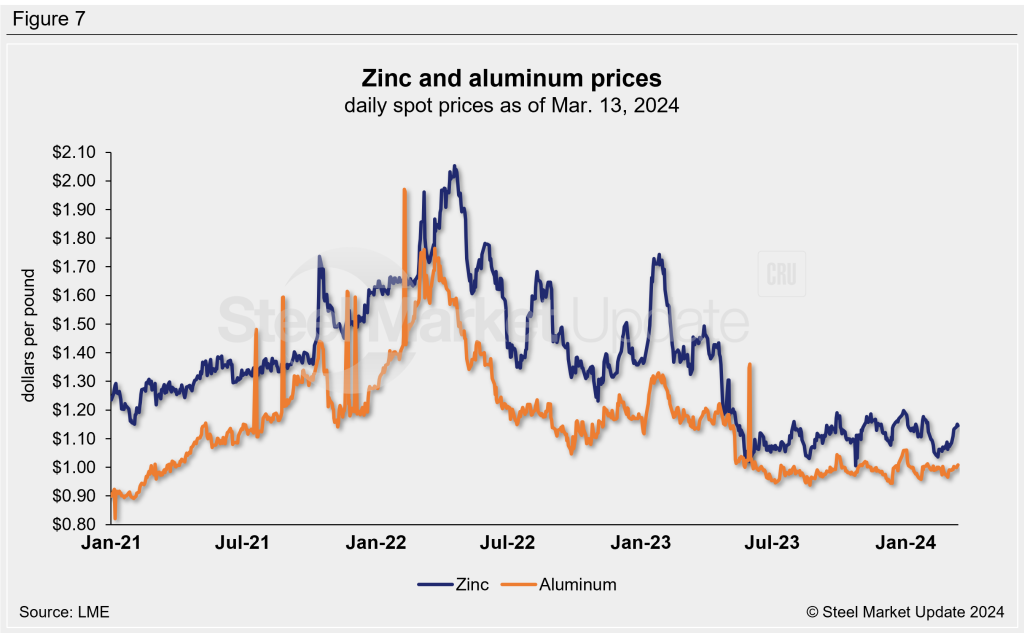
Zinc and aluminum
Zinc is used in galvanized and other coated steel products. Spot prices fluctuated dramatically in the past couple of years, but have remained relatively stable since reaching multi-year lows in mid-2023. The LME cash price for zinc as of March 13 is $1.14 per pound, up 10% m/m and up 4% from levels three months prior. Compared to this time last year, zinc prices are down 15% (Figure 7).
Aluminum prices, which factor into the price of Galvalume, have also stayed near their historically low levels for the past year and a half. (Note that aluminum spot prices sometimes have large swings and return to typical levels within a few days, as seen in the graphic below.) The latest LME cash price is $1.01 per pound as of March 13. Aluminum prices are up just 1% from one month prior, 7% higher than tags three months earlier, but down 11% from prices one year ago.