

Market Data
February 13, 2024
Apparent steel supply recovered in December
Written by David Schollaert
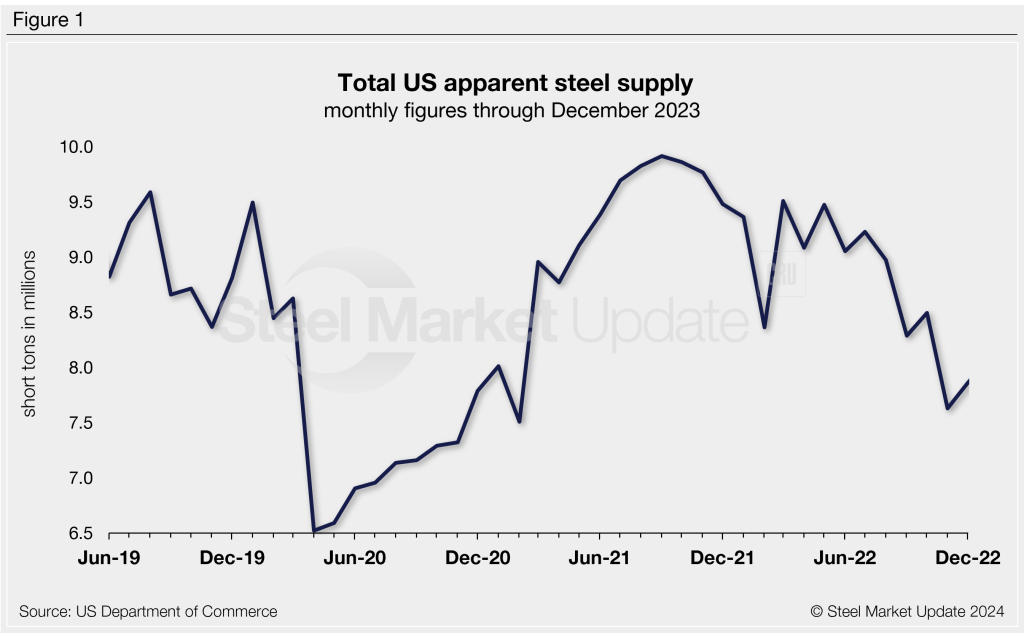
The US apparent steel supply moved up to 7.79 million short tons (st) in December, a rise of 2% from 7.67 million st in November, according to data from the Department of Commerce and the American Iron and Steel Institute (AISI).
Apparent steel supply is determined by combining domestic steel mill shipments and finished US steel imports, then deducting total US steel exports.
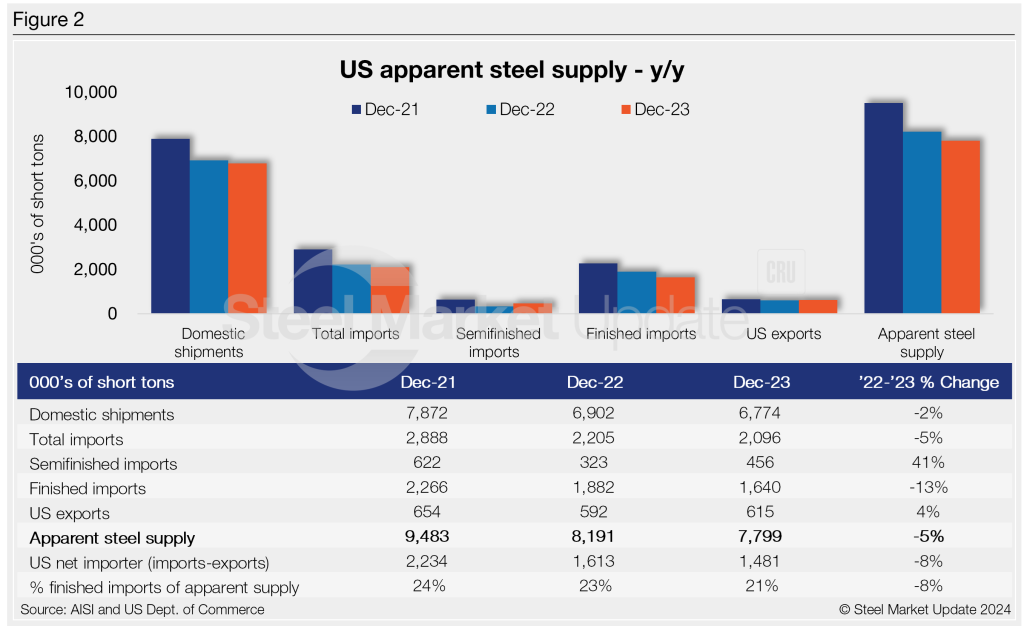
December’s apparent supply total was 392,709 st lower than the same month one year ago when the supply was 8.19 million st. Figure 2 shows December’s trade statistics year over year (YoY) for each of the past three years.
Apparent supply has varied throughout the year, a trend displayed in the chart below (Figure 3). November’s total was the second lowest total all year, nearing 2023’s low of 7.56 million st in February. Figure 3 shows monthly statistics for the last three months.
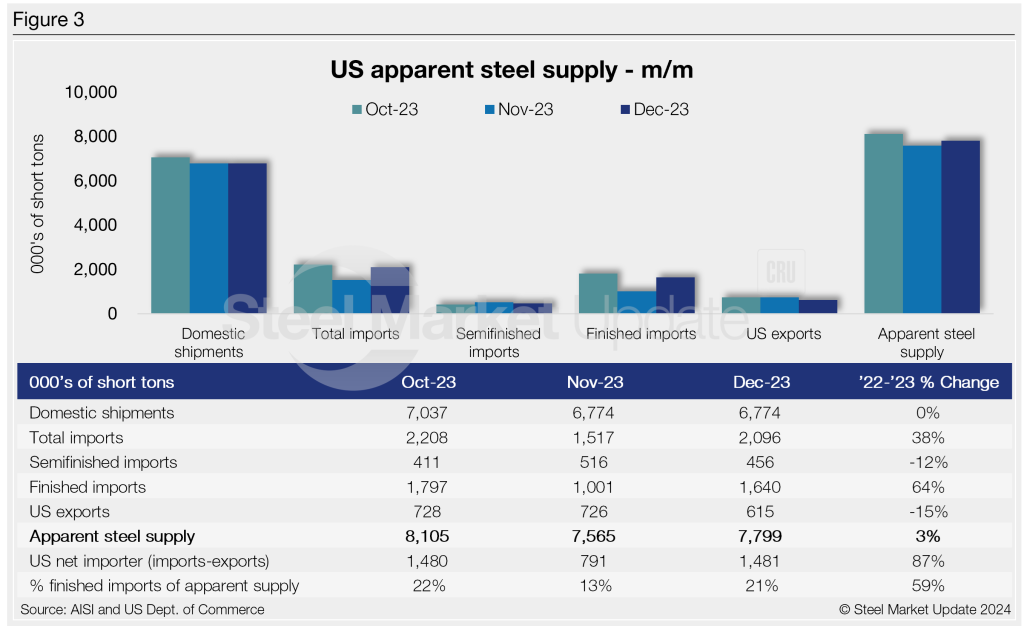
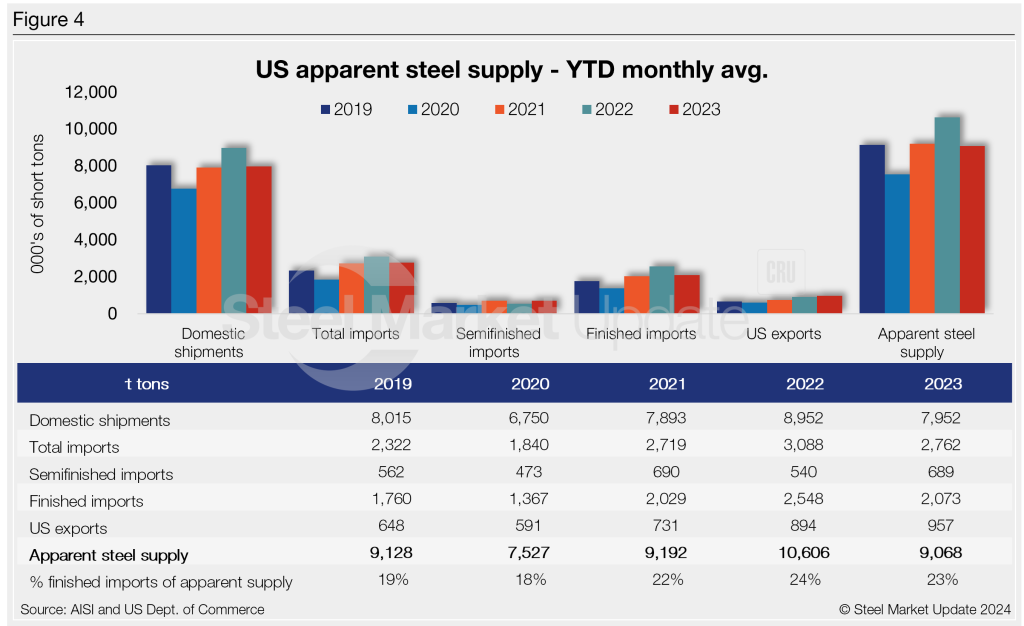
Figure 4 shows year-to-date (YTD) monthly averages for each statistic over the last five years. The average monthly apparent supply level for 2023 was 6.64 million st. The figure was behind 2022 and 2021’s monthly averages of 7.46 million st and 7.89 million st, respectively.
To see an interactive graphic of our apparent steel supply history, click here. If you need any assistance logging into or navigating the website, contact us at info@steelmarketupdate.com.


