Prices

September 12, 2019
Hot Rolled Futures: Testing June Low, Big Move Brewing
Written by David Feldstein
The following article discussing the global ferrous derivatives markets was written by David Feldstein. As an independent steel market analyst, advisor and trader, we believe he provides insightful commentary and trading ideas to our readers. Note that Steel Market Update does not take any positions on HRC or scrap trading, and any recommendations or comments made by David Feldstein are his opinions and not those of SMU or the CRU Group. We recommend that anyone interested in trading steel futures enlist the help of a licensed broker or bank.
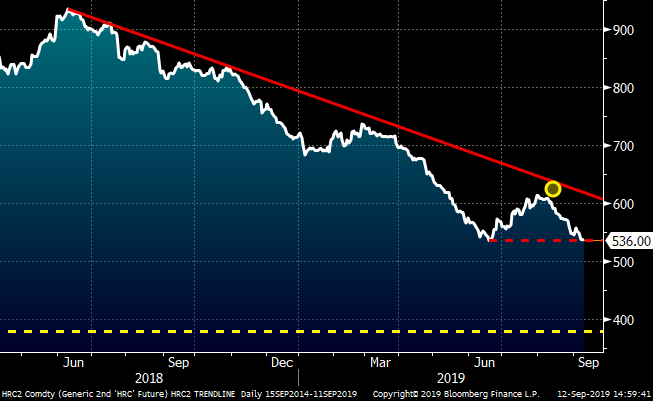
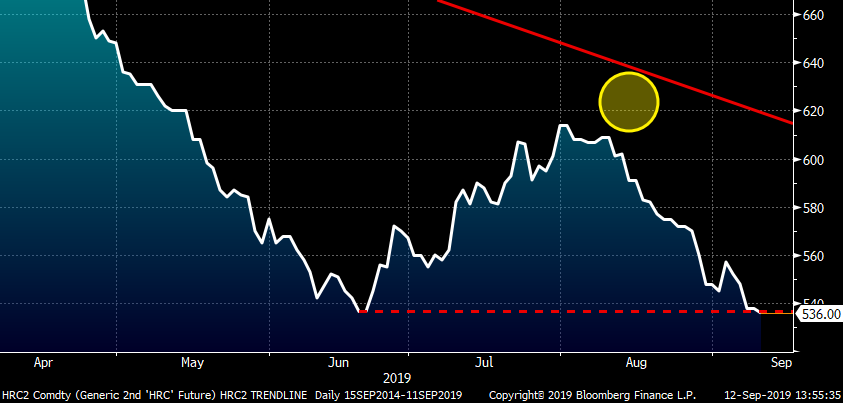
The bear market in Midwest HRC futures continues with HRC2 settling last night at $536, losing around $80/st since early August.
Rolling 2nd Month CME Midwest HRC Future (HRC2)
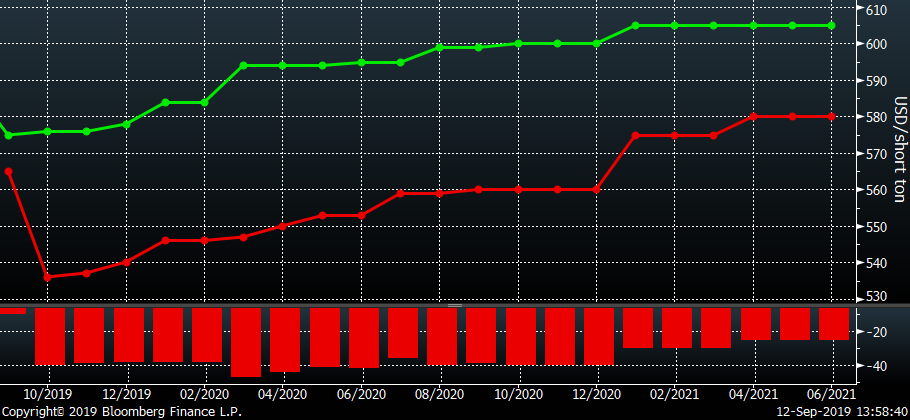
The CME Midwest HRC future curves below saw prices fall ~$40/st (through 2020) in the past three weeks.
CME Midwest HRC Futures Curve
The HRC2 future is testing the lows seen on June 20. There is a strong probability that a sharp price move is imminent. However, that price move could go either way. If the June 20 low holds and HRC2 starts to rally, then the chart will have created a double bottom, which is a strong bullish pattern.
Rolling 2nd Month CME Midwest HRC Future
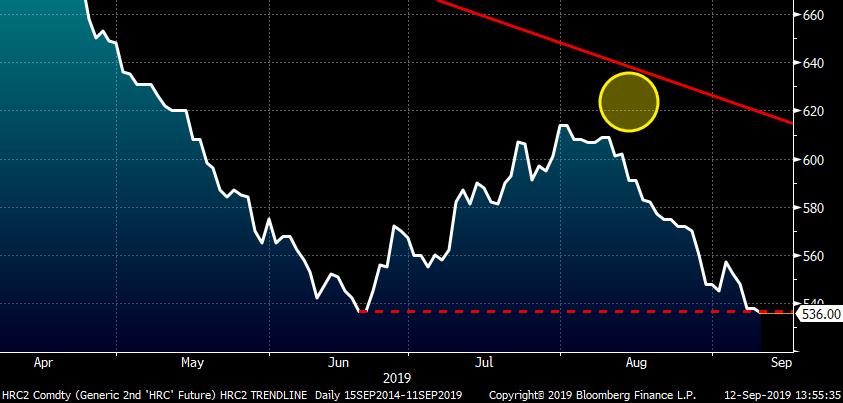
If prices break below this level, then prices will have to drop considerably to a price point that will induce large buyers to step in. Considering these same large buyers likely bought in size three months ago and may still be sitting on inventory and/or receiving these orders, they may not be as excited to add more tons at the same prices seen in June. If that’s the case, expect prices to fall much further.
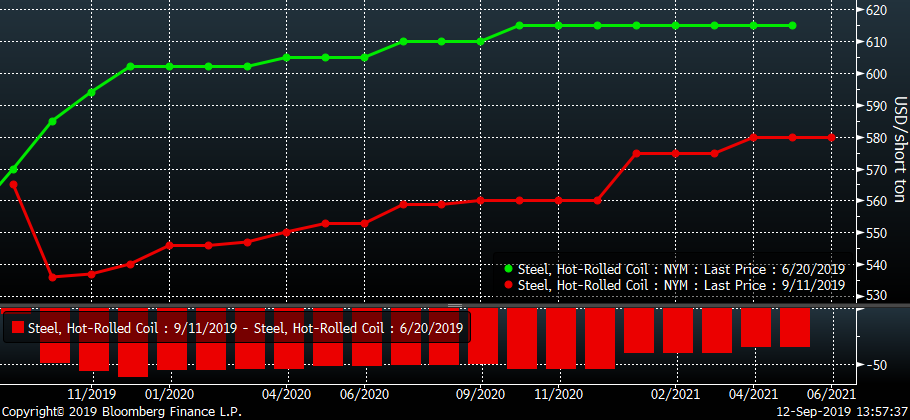
Consider the following data points that bolster the bear case. This chart shows the HRC futures curve on June 20 when HRC2 bottomed vs. the curve last night. On June 20, HRC futures provided the opportunity to hedge physical purchases rumored to be transacting in the $475-$525 range at over $100 above these physical deals. Today, the curve has moved over $50 lower and doesn’t provide as much cover. The curve is also very telling about the market’s expectations for future prices. To be clear, it doesn’t mean these expectations will be correct, just look at what they thought in June, but it does provide some insight as to the market’s sentiment.
CME Midwest HRC Futures Curve
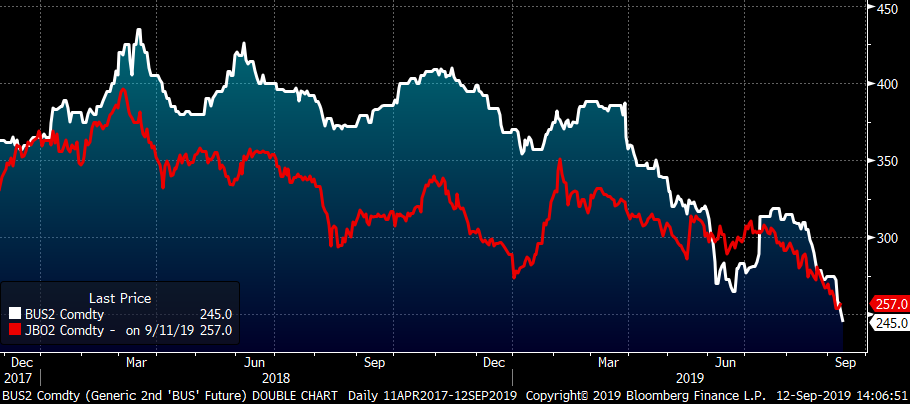
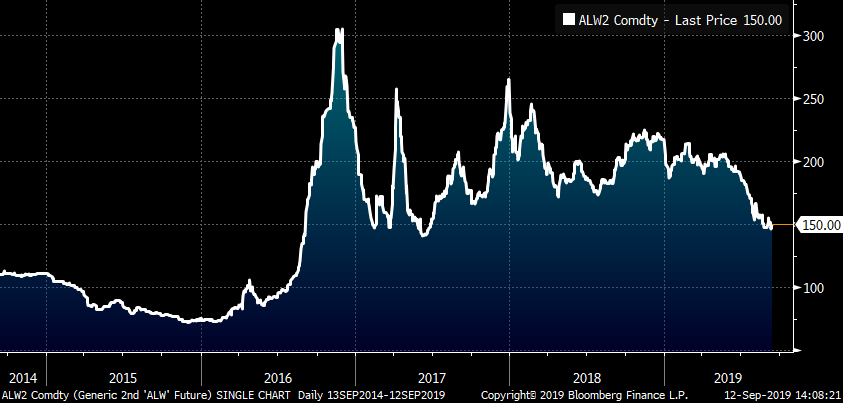
The prices of ferrous raw materials have fallen significantly since June 20 with scrap making new lows, iron ore down 15 percent and coking coal down 22 percent.
2nd Month CME Busheling Futures (white) & 2nd Month LME Turkish Scrap (red)
Rolling 2nd Month SGX Iron Ore Future
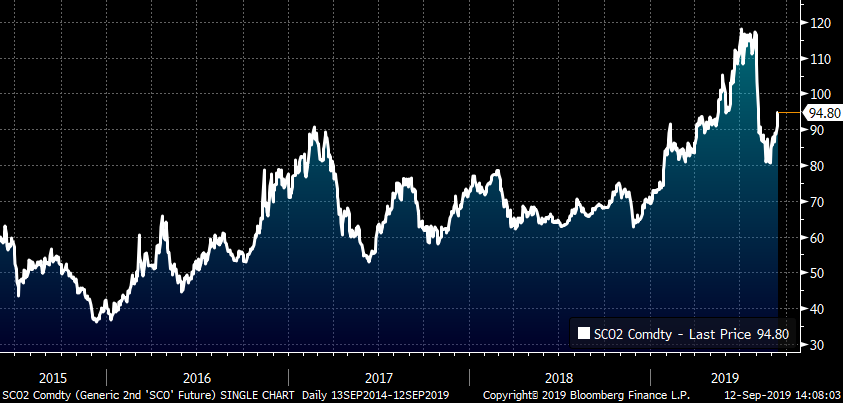
Rolling 2nd Month Coking Coal Future
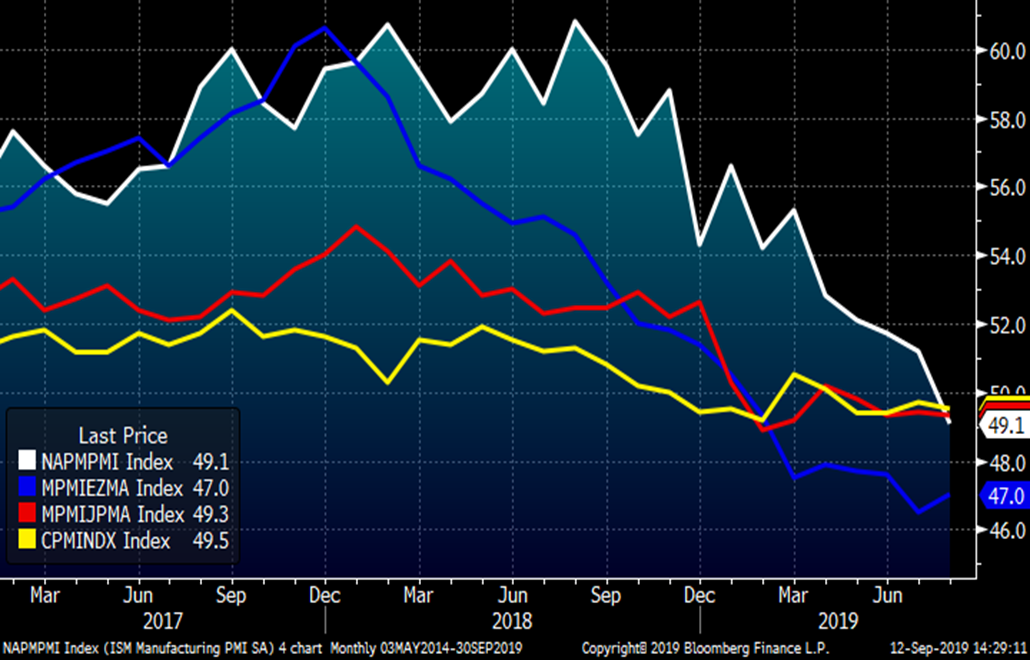
Meanwhile, the PMIs of the U.S., Eurozone, China and Japan are simultaneously in contraction. Compare this to the strength seen in December 2017 when there was collective strength globally in manufacturing.
Manufacturing PMIs for U.S. (white), Eurozone (blue), Japan (red) and China (yellow)
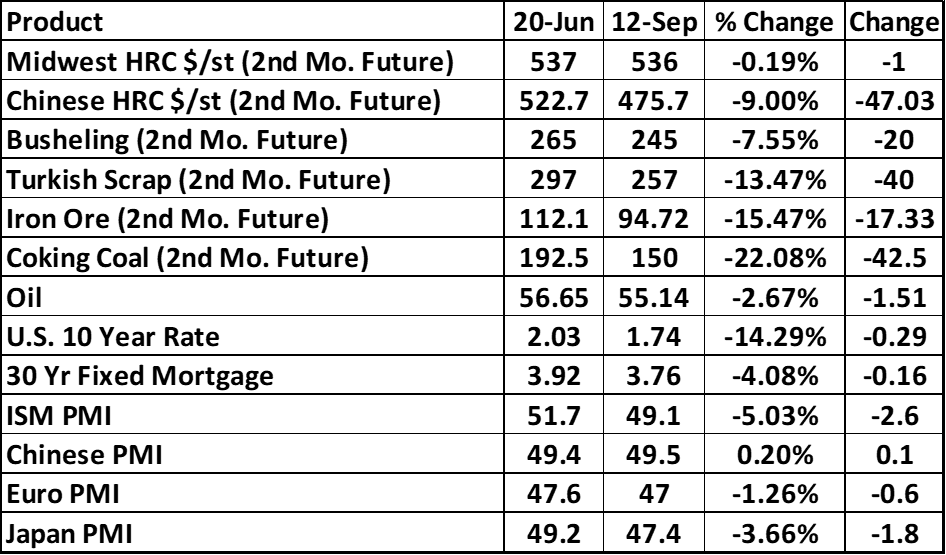
This table compares the performance of these products and more on June 20 vs. real-time prices.
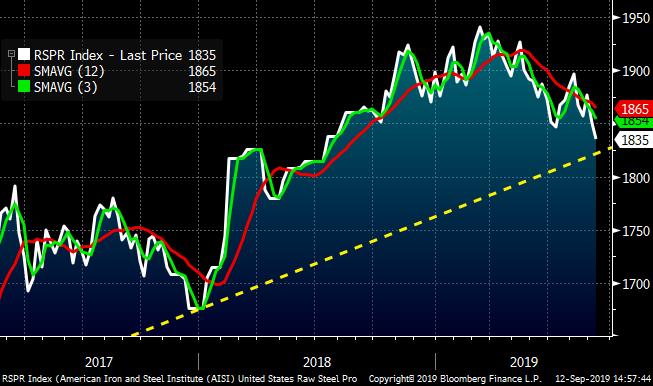
Steel (over)production has been a major factor in the price slide this year. However, AISI crude steel production has moved to its lowest level since July 2018 and is approaching its multi-year up trend line. A consistent drop in production would be a welcome relief to the industry and help boost Midwest flat rolled prices…
AISI Weekly U.S. Crude Steel Production
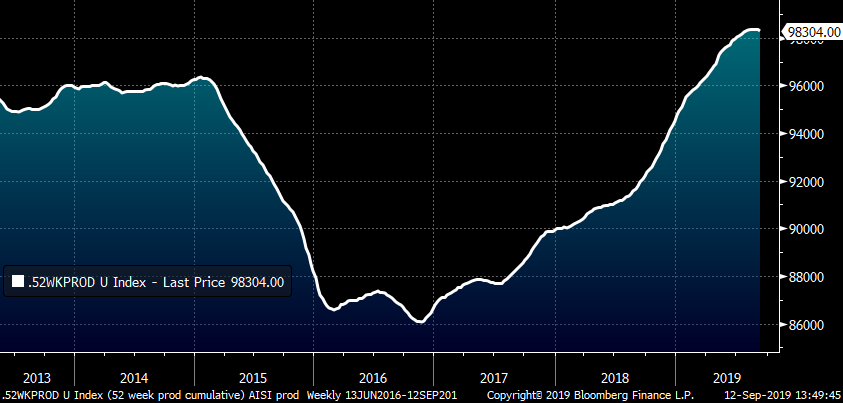
…eventually. This chart shows a moving sum of the previous 52 weeks of AISI crude steel production. While this 52-week cumulative sum looks to have topped, there is still a tremendous overhang from a year of overproduction.
AISI U.S. Crude Steel Production 52-Week Moving Sum
In addition, the oversupply in the Midwest has been exacerbated by the tariffs. While imports have fallen, exports have fallen in line with the drop in imports. It seems that part of the oversupply in the Midwest is a result of tons produced in the Midwest that would have been exported and are instead remaining in the Midwest. The compression in the differential between the price of Houston HRC and Midwest HRC, which has fallen close to the cost of shipping steel from the Midwest to Houston, looks to be evidence of this.
Consider the following bullish points. If HRC2 double bottoms and rallies, then one major catalyst would be the over 600,000 tons of production coming offline in Q4 due to planned outages across domestic mills.
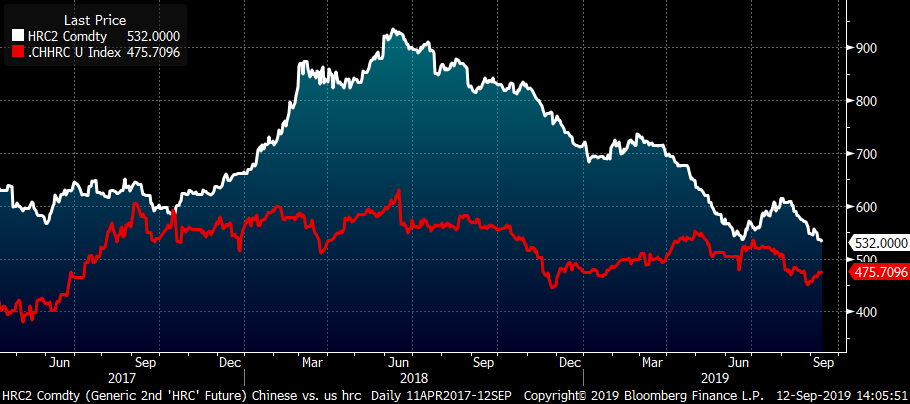
Another positive development is the compression of the differential between the price of Midwest and Chinese HRC. This should result in more orders for the domestic mills.
SHFE Chinese HRC Future $/st vs. CME Midwest HRC Future $/st (both 2nd Month)
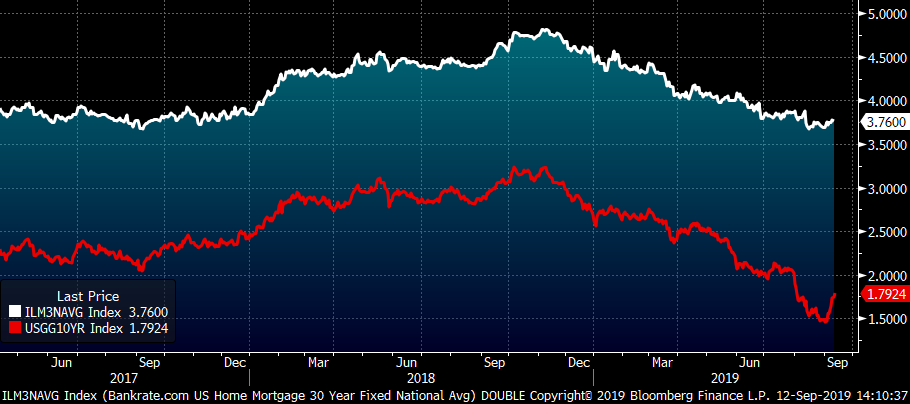
Finally, interest rates are down huge this year. Mortgage rates have fallen 75 basis points, which will boost residential real estate and benefit U.S. consumers. On the commercial side, lower interest rates will not only free up cash flow by lowering interest expense and through refinancing, but also boost new investment through cheaper financing. While falling rates have added deflationary pressure on many commodities, rates may have bottomed and started a new rally. These lower rates act as an economic stimulus with the benefits to be felt in the months ahead.
U.S. Ten-Year Treasury Rate & Bankrate.com Avg. 30-Year Mortgage Rate
So, what can you do about it?
Assuming that a large move is in fact imminent, watch how the futures trade around this low. If they break below $535, sell, sell, sell, but if $535 holds and they start to rally, then bid ’em up expecting prices to rally at least back above $600 at which time the trend line will come into play.
Rolling 2nd Month CME Midwest HRC Future
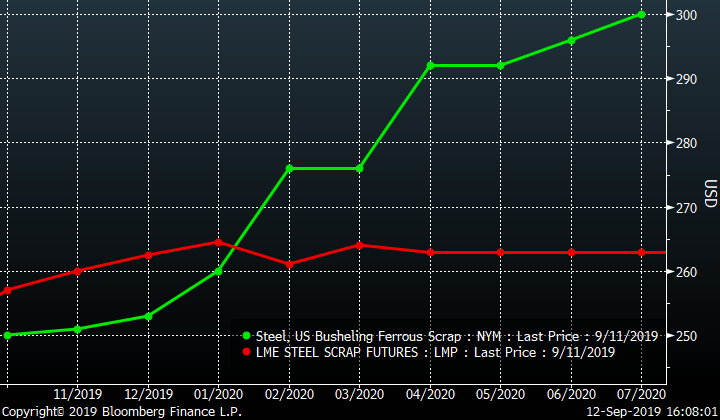
An alternative strategy would be to take advantage of the oversold busheling futures. As you can see below, busheling has traded below LME Turkish scrap, so targeting a long busheling short Turkish scrap in the months of November through January might be a very solid alternative if you want to get long without taking on directional price risk.
CME Busheling Futures (green) & LME Turkish Scrap Futures (red) Curves
One other alternative to manage a significant price move would be to buy options on HRC futures if you can get them at a reasonable value. Ideally, you would buy a straddle or strangle where you would buy both calls (upside) and puts (downside). However, options on HRC futures lack liquidity. Jack Marshall at Crunch Risk did tell me today there was a trader asking $22/st for $600 calls for the first six months of 2020 and $13/st for a $575-$625 call spread also for the 1H 2020.


