Market Data
January 21, 2025
Fed indicators show continued stability in manufacturing
Written by Brett Linton
Editor’s note: Steel Market Update is pleased to share this Premium content with Executive members. For information on how to upgrade to a Premium-level subscription, contact Luis Corona at luis.corona@crugroup.com.
Recent Federal Reserve data indicates that the US manufacturing sector remains healthy and stable. Industrial production and new manufacturing orders remain strong through November and December. Factory orders for iron and steel products held steady in November, while inventory values continued to decline. The strength of the manufacturing economy has a direct relationship to the health of the steel industry.
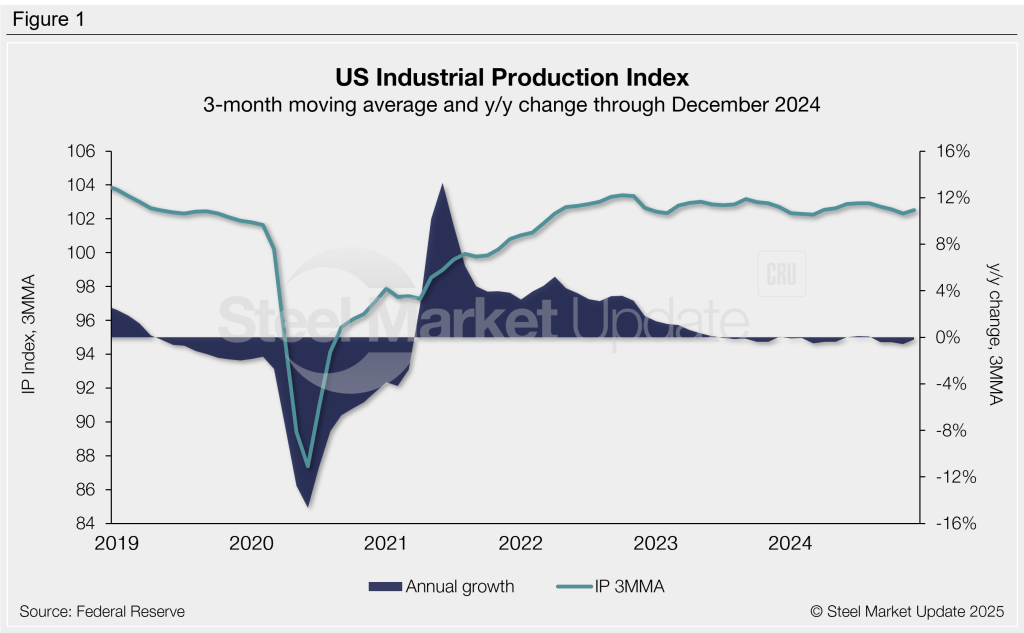
Industrial Production
The Industrial Production (IP) index measures output from factories, mines, and utilities. To smooth month-to-month fluctuations, the index is presented as a three-month moving average (3MMA) in Figure 1. Through December the IP index stood at 102.5, strong territory it has remained in for nearly three years. Compare this to the record high 3MMA rate of 104.1 seen in October 2018, the highest level witnessed in our 32-year history.
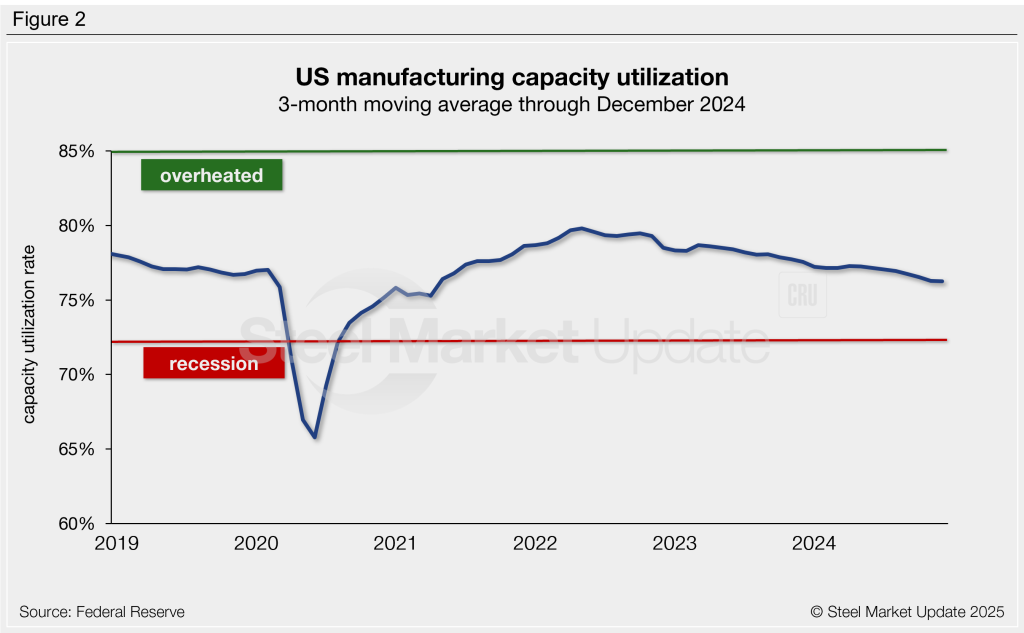
Manufacturing capacity utilization
Manufacturing capacity utilization has been trending lower since mid-2022 but remains healthy and is above recessionary territory. The 3MMA rate fell to 76.3% through December, the lowest level recorded since April 2021 (Figure 2).
Capacity utilization averaged 76.8% across 2024. This is down compared to recent years (2023 averaged 78.2%, 2022 79.2%, 2021 77.1%).
For context, capacity utilization had hovered around 74–78% for most of the 2010s, stalling in early-2020 to reach a low 3MMA of 65.8% in June 2020.
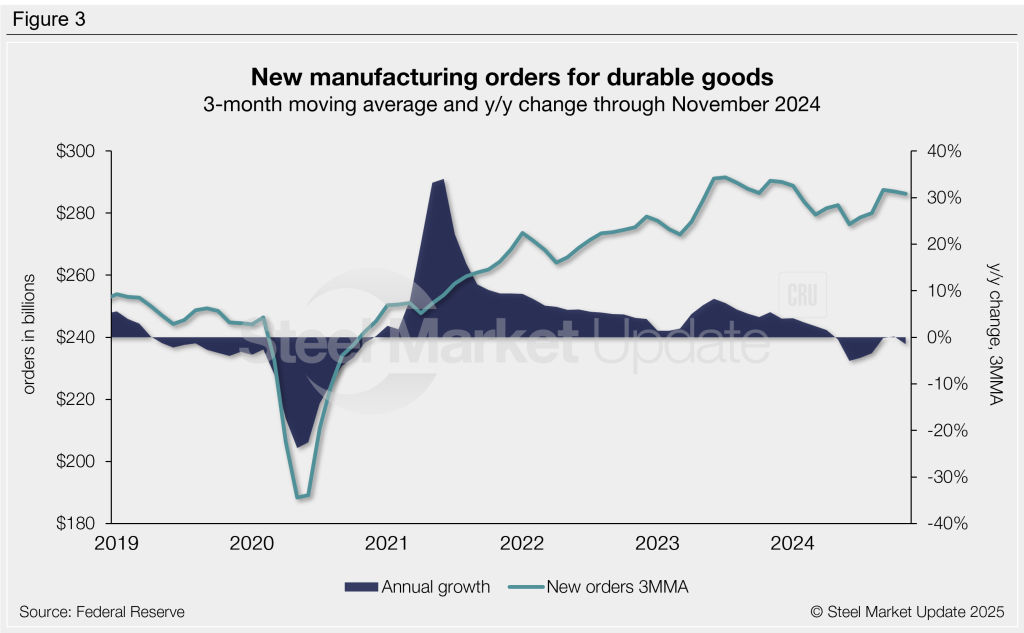
New orders for all durable goods
Durable goods new orders are an early indicator of consumer and business demand for US manufactured goods. This measure continues to recover from the 2020 shock, with positive annual growth occurring every month from December 2020 through April 2024.
New orders eased to $286.2 billion as a 3MMA through November (Figure 3). While this rate is down 1.4% from levels one year prior, it is one of the highest figures observed in our 33-year data history.
Factory orders for manufactured products
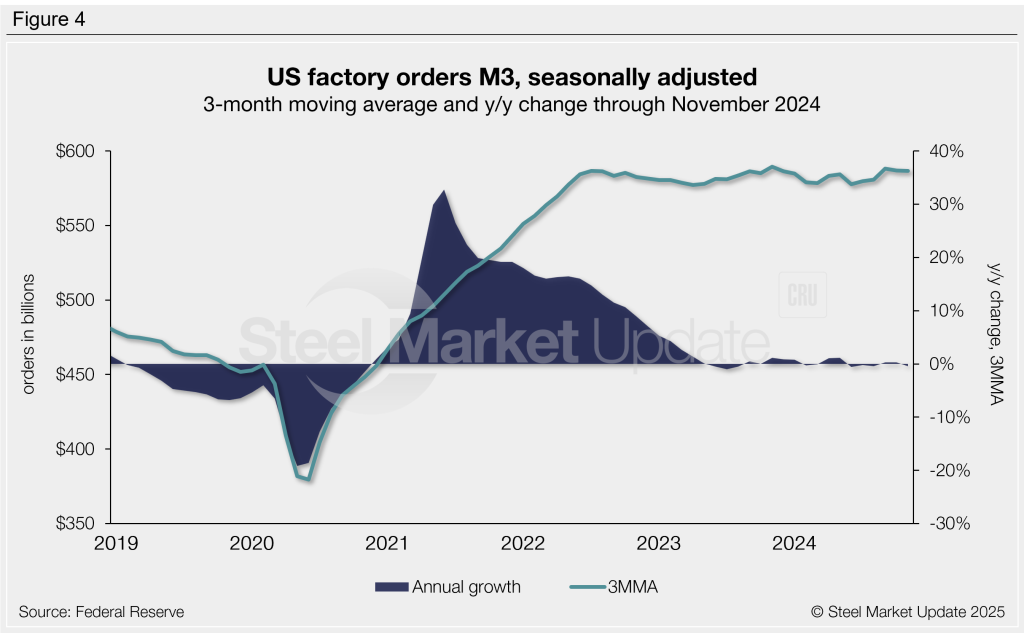
New factory orders for manufactured products remain near historical highs, following the historically strong recovery seen in 2021 and 2022. The annual growth rate of new orders has remained stable since early 2023.
The 3MMA through November fell slightly to $586.6 billion. This is down 0.5% compared to the $589.3-billion level seen one year earlier, which was the highest 3MMA recorded in our 31-year data history (Figure 4).
New orders for iron and steel manufacturing
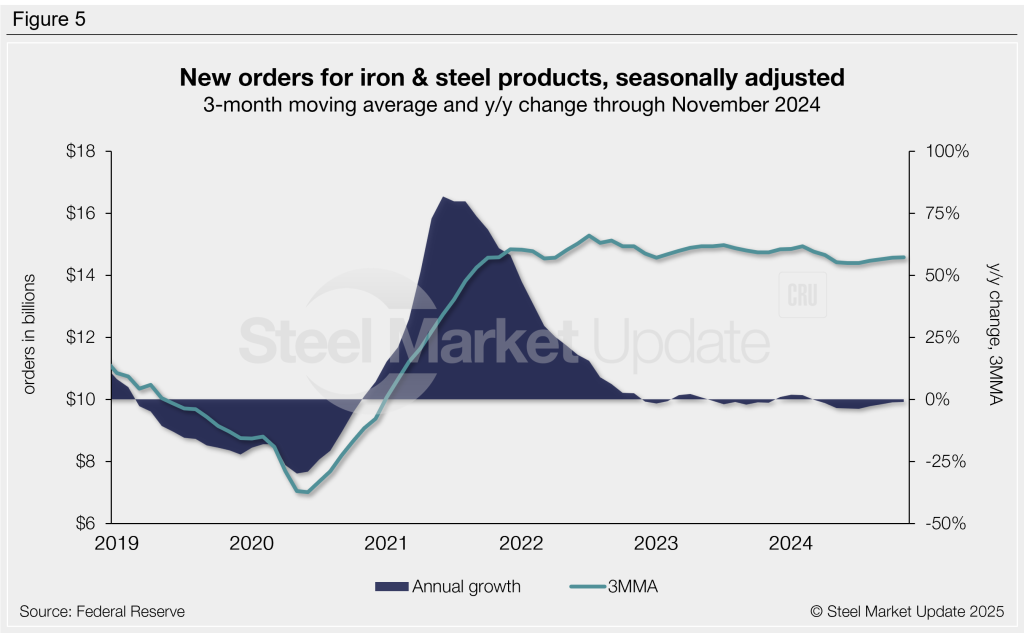
Federal Reserve manufacturing data has a subsection for iron and steel products. Figure 5 shows the value of new orders for iron and steel products as a 3MMA. This measure saw remarkable growth from mid-2020 through 2021, reaching a record high 3MMA of $15.3 billion in July 2022. The 3MMA through November was $14.6 billion, a ballpark it has been in for over three years.
Like manufacturing new orders above, the annual growth rate of new iron and steel product orders has been minimal since late 2022, registering -1.1% through November. Recall that this rate had peaked in June 2021 at 81.8%, an 11-year high.
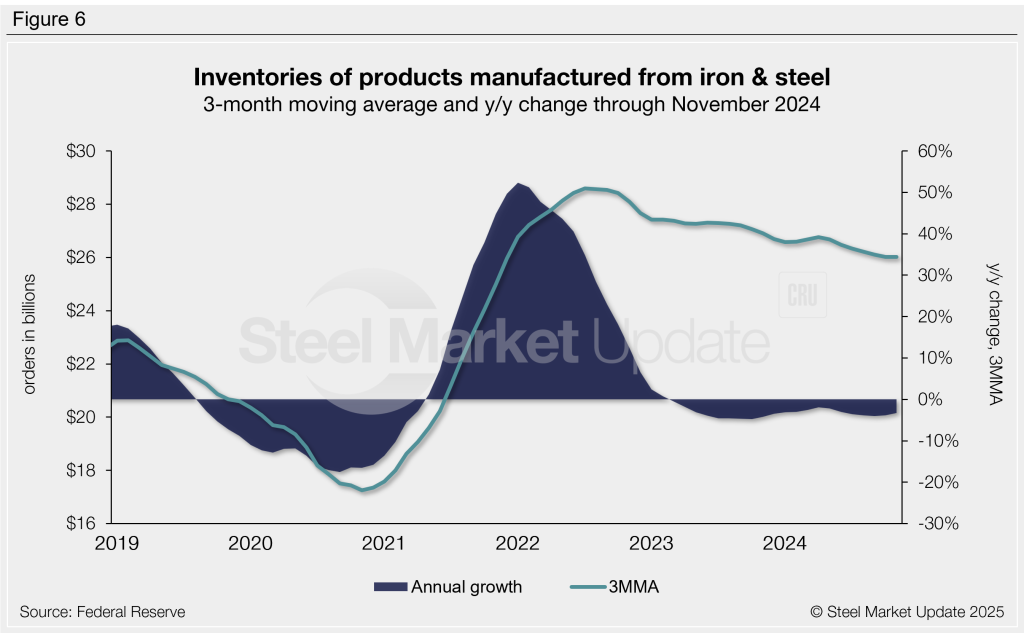
Inventories of products manufactured from iron and steel
Inventories of iron and steel products broke their multi-month increase streak in mid-2022 and have been gradually trending lower since (Figure 6). The latest iron and steel inventory levels totaled $26.0 billion on a 3MMA basis through November. This is down 3.3% compared to the same period one year prior, marking the 21st consecutive month of negative annual growth.