Analysis
January 3, 2025
Global steel production fell 4% in November
Written by Brett Linton
Editor’s note: Steel Market Update is pleased to share this Premium content with Executive members. For information on how to upgrade to a Premium-level subscription, contact Luis Corona luis.corona@crugroup.com.
The total volume of crude steel produced by mills around the world fell by 4% from October to November, according to the latest data from the World Steel Association (worldsteel). Global steel mill output totaled 146.8 million metric tons (mt) in November, marking the third-lowest monthly rate seen in 2024 to date.
Over the first 11 months of 2024, global steel production averaged 153.7 million mt per month. This was 2.0 million mt (1%) lower than the same period of 2023. November production was 4% lower than the 2024 YTD average, but 1% greater than the same month one year prior.
On a three-month moving average (3MMA) basis, global production slightly increased from October to November, rising less than 1% to 147.7 million mt. While up month on month (m/m), this was one of the lower 3MMA measures recorded in 2024.
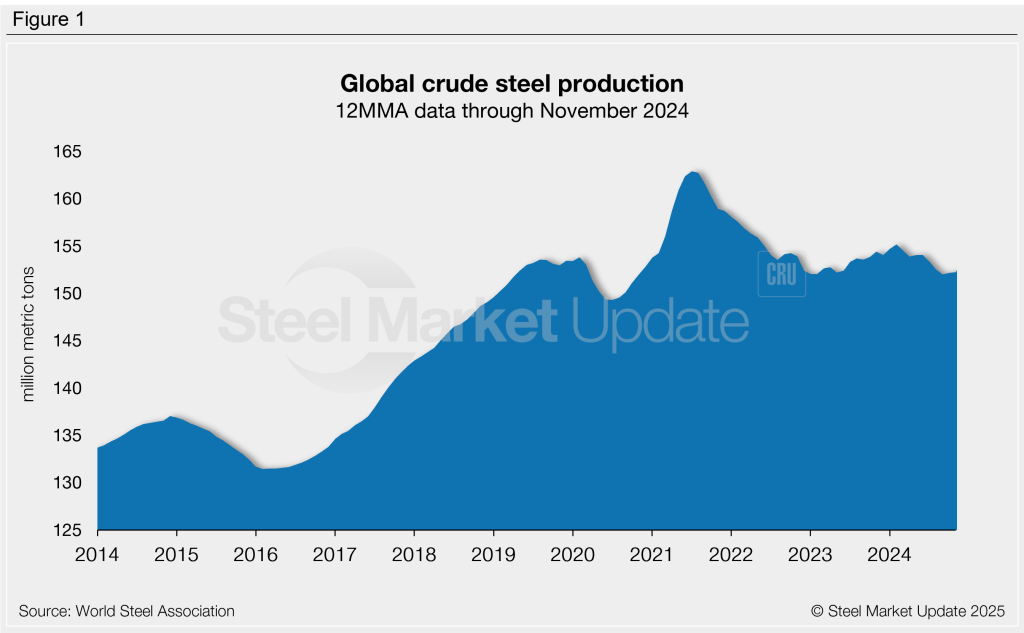
On a 12-month moving average (12MMA) basis, production has averaged 152.2 million mt per month over the past year, 1% less than the November 2023 12MMA of 154.4 million mt (Figure 1).
On a daily basis, November production averaged 4.89 million mt per day. This was in line with October’s daily rate of 4.91 million mt and 1% higher than the same month last year.
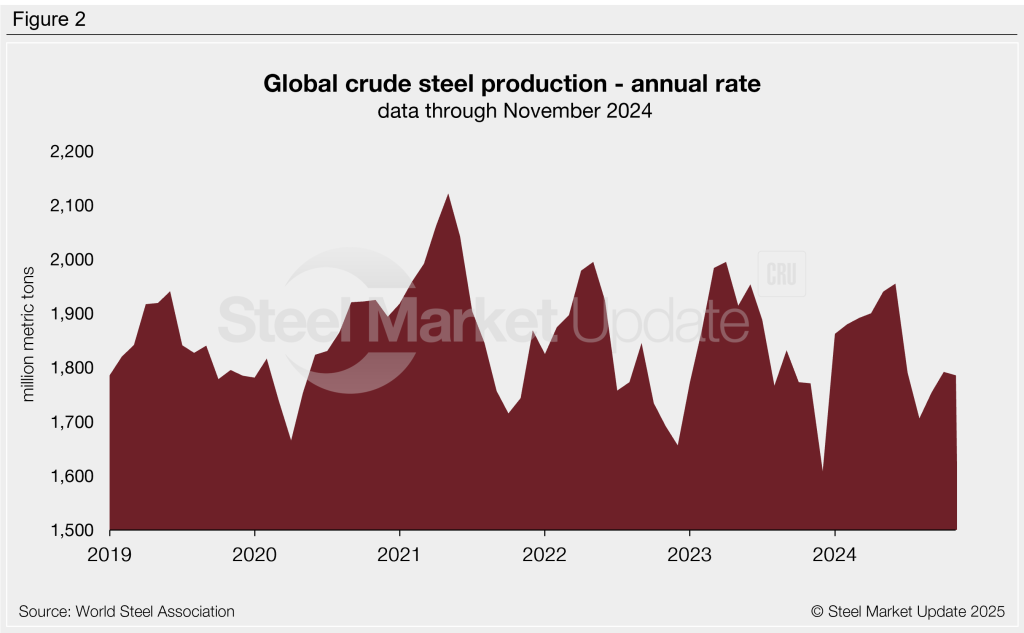
Annualizing the daily production rate in November yields an annual production rate of 1.79 billion mt (Figure 2). This figure has trended higher since August, when we witnessed an eight-month low of 1.71 billion mt. One year prior the annual rate was 1.77 billion mt in November 2023, while two years ago it was 1.69 billion mt.
Regional breakdown
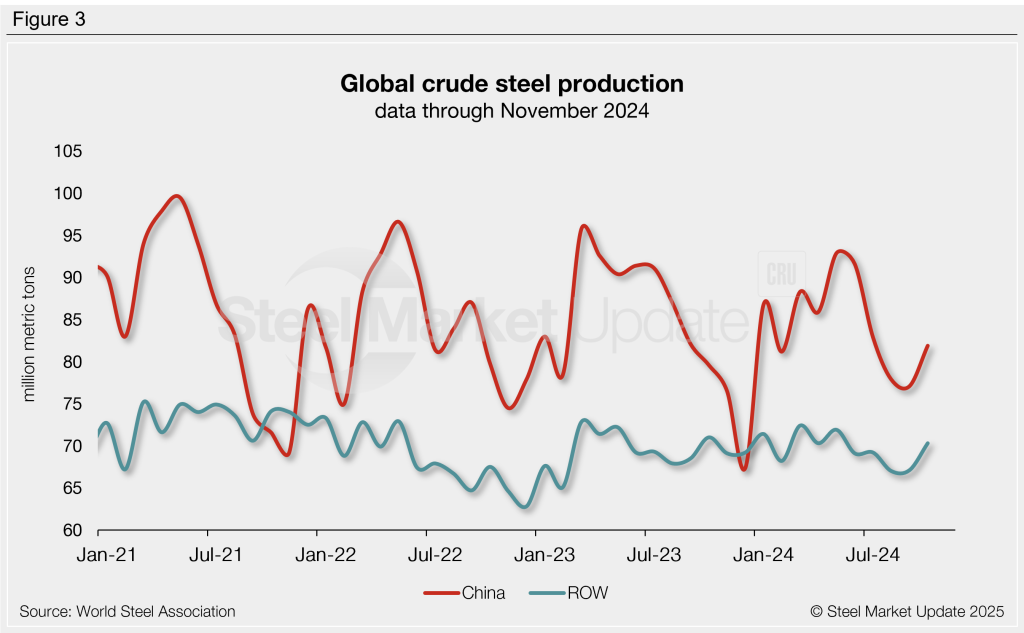
China, the world’s top steel producer, produced 78.4 million mt last month (Figure 3). This was 4% lower than October levels, but 2% greater than the same month one year ago. Recall that earlier this year, Chinese production climbed to a 14-month high of 92.9 million mt in May. Year-to-date Chinese production has averaged 84.1 million mt per month across 2024.
Chinese production accounted for 53% of the world’s total steel output in November, similar to August and October and the lowest rate seen in 2024. Recall that this rate peaked back in June at an 11-month high of 57%. China also represented 53% of global output one year prior to this.
Following a five-month high in October, steel output from the rest of the world (ROW) declined in November. ROW production totaled 68.4 million mt in November, down 3% from October and 1% lower than the same month last year. For the first 11 months of 2024, ROW production has averaged 69.6 million mt per month.
Production by country
India was the second-largest steelmaker with 12.4 million mt of steel produced in November. Next up was Japan at 6.9 million mt, followed by the United States at 6.4 million mt, Russia at an estimated 5.5 million mt, and South Korea at 5.2 million mt.