Market Data
September 20, 2024
Fed indicators show a stable manufacturing sector
Written by Brett Linton
Editor’s note: Steel Market Update is pleased to share this Premium content with Executive members. For information on upgrading to a Premium-level subscription, contact Luis Corona at luis.corona@crugroup.com.
The latest Federal Reserve data paints a healthy and stable manufacturing sector. US industrial production, capacity utilization, new factory orders, and inventories remained steady through July and August. The strength of the manufacturing economy directly affects the health of the steel industry.
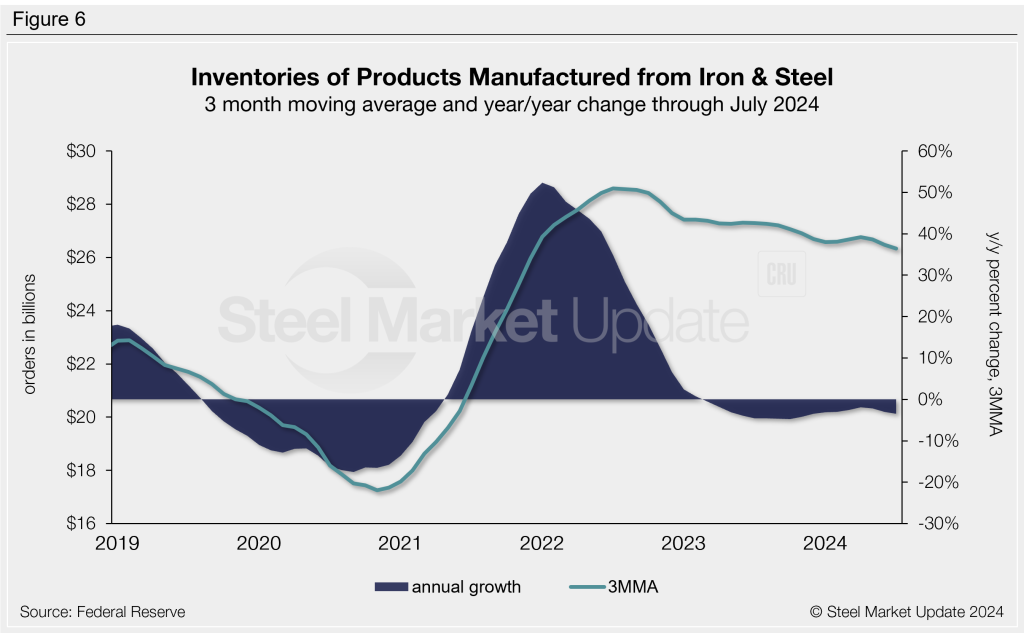
Industrial Production
The Industrial Production (IP) index is a gauge for factory, mine, and utility output. Figure 1 shows the IP index since 2019, graphed as a three-month moving average (3MMA) to smooth out the variability seen month to month. The latest IP index reading was 102.9 through August, the second-highest level recorded in the past nine months. As a 3MMA, this index has steadily remained within this strong range for the past two and a half years.
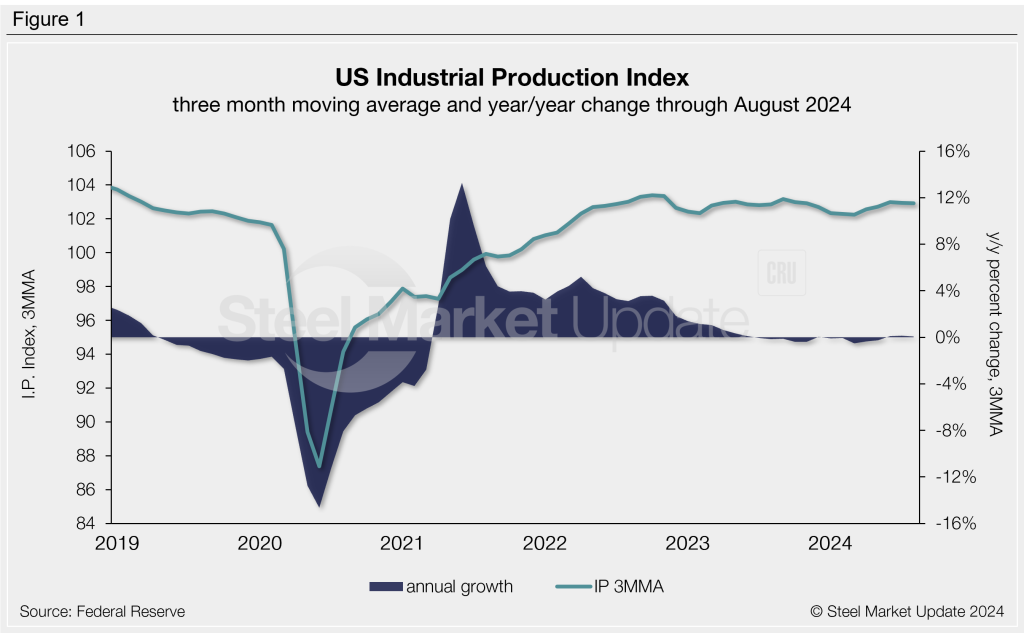
Manufacturing capacity utilization
Manufacturing capacity utilization has been edging lower across 2024, continuing a trend that began in 2022. Utilization fell to a 3MMA of 77.0% through August. While still a healthy rate, it’s also the lowest level recorded in over three years. In 2023, we saw an average rate of 77.8%, compared to 79.2% in 2022 and 77.1% in 2021. Capacity utilization has remained above recessionary territory since its recovery in late 2020. For reference, capacity utilization had hovered around 74–78% for most of the 2010s before stalling early in 2020 and reaching a low of 65.8% in June 2020 (Figure 2).
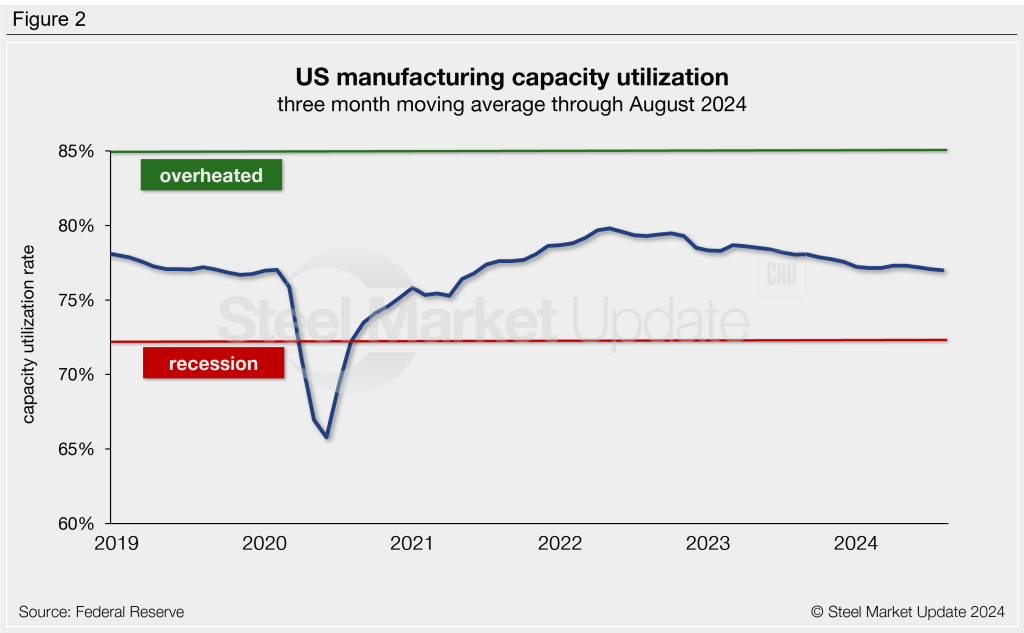
New orders for durable goods
New orders for durable goods are an early indicator of consumer and business demand for US manufactured goods. This measure has been recovering since December 2020, with positive y/y growth every month through April of this year. New orders are at $278.7 billion on a 3MMA basis through July (Figure 3). This rate is down 4.4% from a year earlier. July marks the third month in a row with a negative annual growth rate.
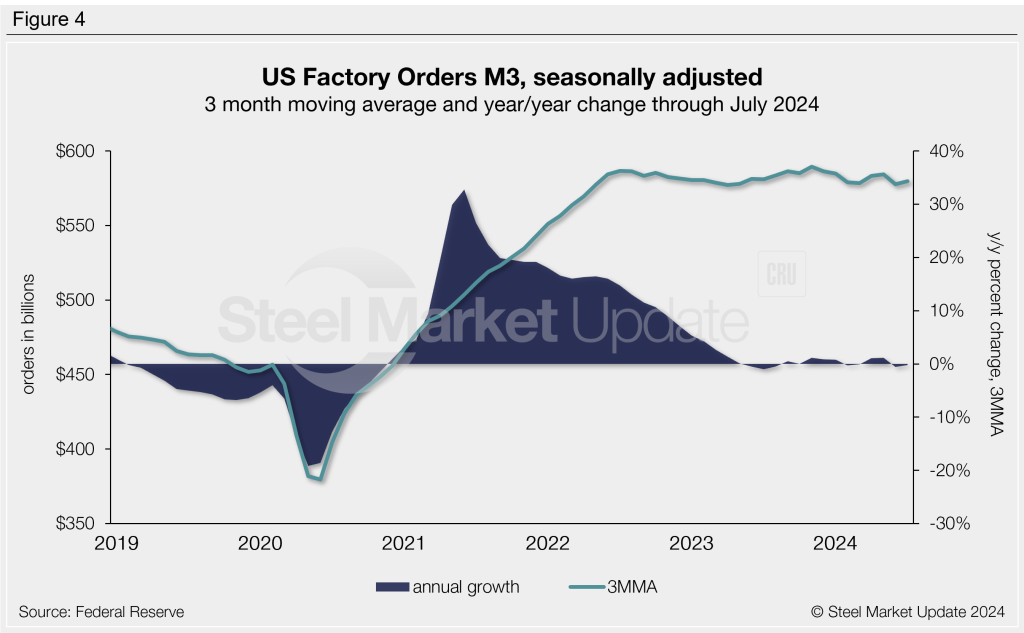
New orders for manufactured products
Growth in new orders for manufactured products was historically strong in 2021 and 2022. The growth rate stabilized entering 2023 and has been flat since. While growth has been relatively stable, the value of factory orders remains near historical highs. The highest 3MMA level in our 30-year data history was recorded last November at $589.3 billion (Figure 4). The 3MMA through July is down slightly to $579.8 billion, 0.2% below the year-ago level.
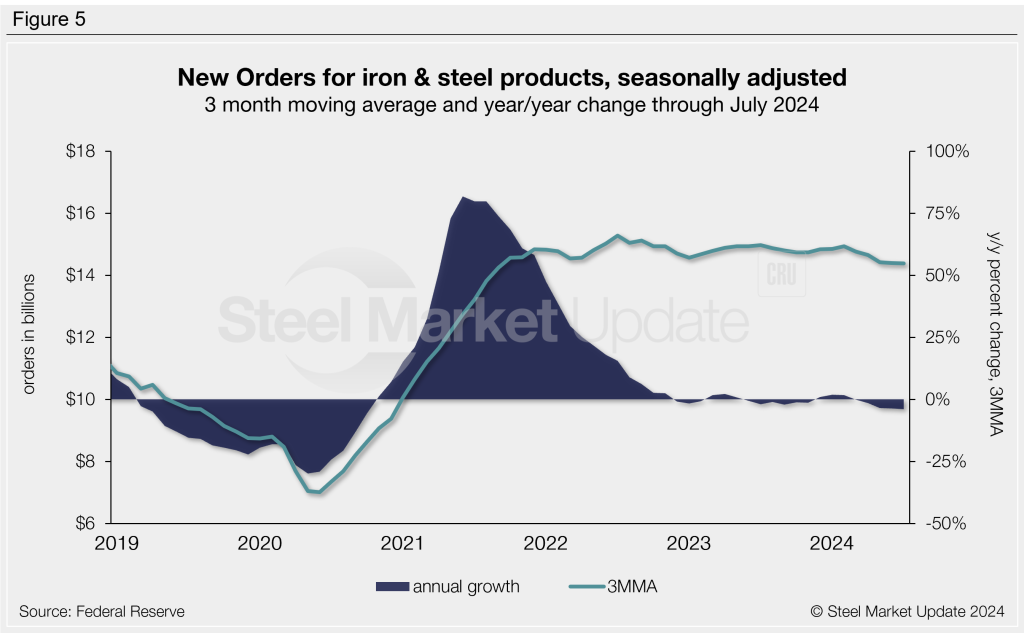
New orders for iron and steel manufacturing
Federal Reserve manufacturing data includes a subsection for iron and steel products. Figure 5 shows the value of new orders for iron and steel products as a 3MMA. This measure saw remarkable growth from mid-2020 through 2021, reaching a record-high 3MMA of $15.3 billion in July 2022. The 3MMA through July 2024 was $14.4 billion, a ballpark it has been in for nearly three years. The y/y growth rate has fluctuated around zero since late 2022, registering -3.9% through July. This rate reached an 11-year high of 81.8% in June 2021.
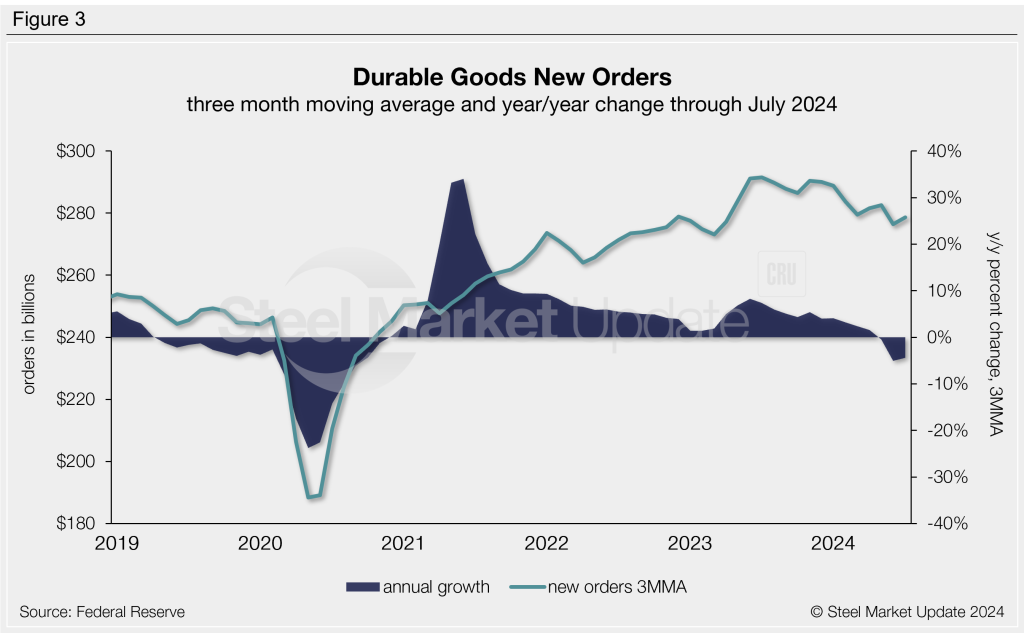
Inventories of products manufactured from iron and steel
Inventories of iron and steel products broke a multi-month increase streak in mid-2022 and have been gradually declining since (Figure 6). The latest iron and steel inventory levels totaled $26.3 billion on a 3MMA basis through July, down 3.5% compared to last year. The 3MMA annual growth rate has been negative since March 2023, reaching a 31-month low of -4.7% late in 2023.