Market Data
July 16, 2024
US monthly raw steel production reached 9-month high through May
Written by Brett Linton
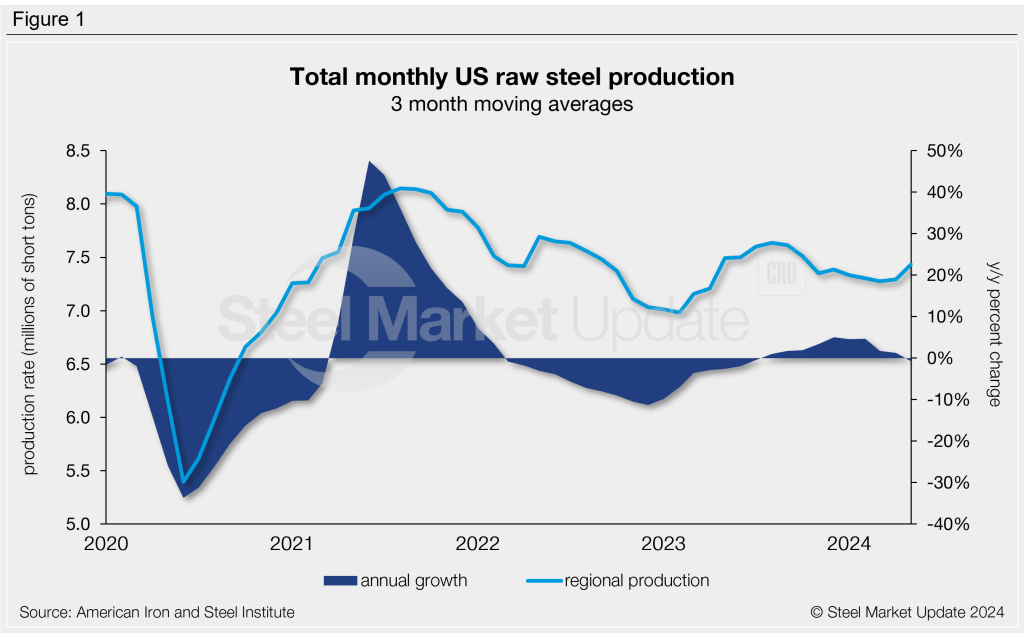
US raw steel mill production ticked up to 7.57 million short tons (st) in May, a 4% increase from the prior month, according to recently released American Iron and Steel Institute (AISI) data. May marks the highest monthly production rate seen since August 2023.
Domestic production has generally trended downward over the past year, following the 15-month high of 7.71 million st seen last August. May production is just 37,000 st less than the same month last year.
Note that AISI’s monthly production estimates are different than the weekly estimates SMU reports each Tuesday. The monthly estimates are based on over 75% of domestic mills reporting vs. only 50% reporting weekly estimates.
Figure 1 compares monthly production data on a three-month moving average (3MMA) basis to smooth out monthly fluctuations. Raw steel production averaged 7.43 million st per month between March and May, the highest 3MMA recorded in seven months. 3MMA production is down 1% from the same period in 2023.
Production by region
SMU publishes regional steel production data for the six regions responsible for 5% or more of total domestic production, respectively.
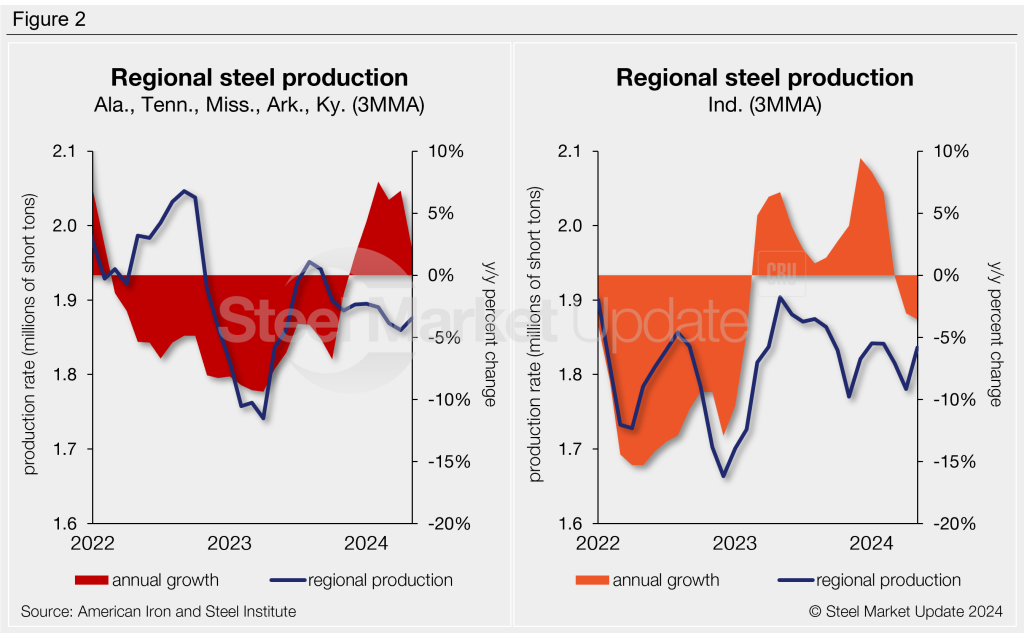
The left graph in Figure 2 shows 3MMA production history from the combined states of Alabama, Tennessee, Mississippi, Arkansas, and Kentucky. Production in this region has trended downward since peaking last August. The latest 3MMA through May is 1.88 million st, up 2% compared to the same period in 2023.
The right graph in Figure 2 shows Indiana production as a 3MMA, now at 1.84 million st through May. Production has fluctuated around this level for the last seven months. The May 3MMA is down 4% from levels one year prior.
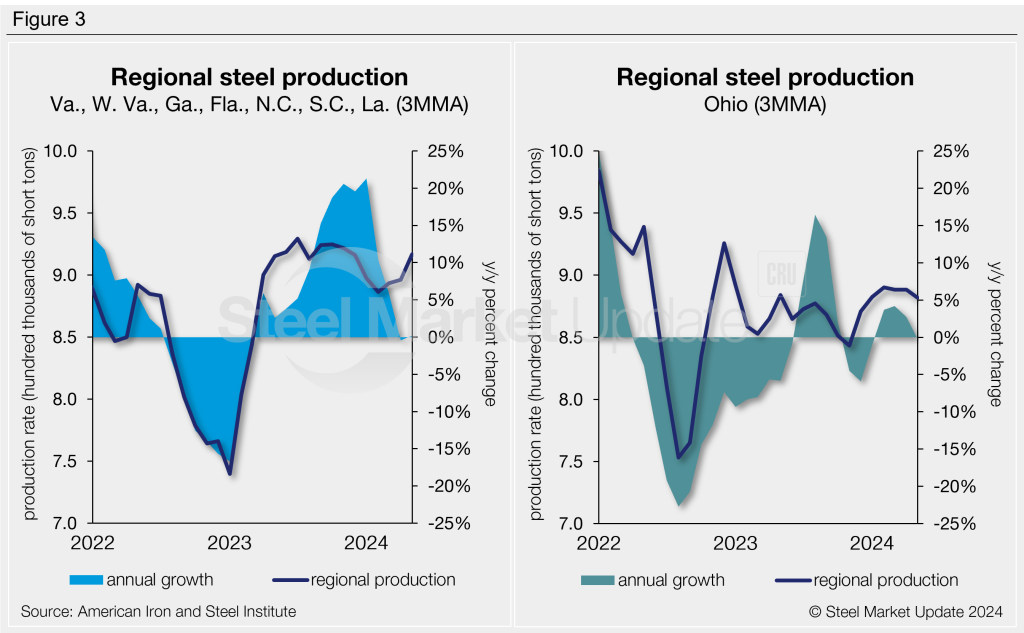
The left graph in Figure 3 shows the combined production in Virginia, West Virginia, Georgia, Florida, North Carolina, South Carolina, and Louisiana as 3MMA production in this region has picked up steam in recent months, now at a six-month high and nearing highs seen in 2023. The latest 3MMA through May is 917,000 st, less than 1% higher than the same period last year.
On the right side of Figure 3 we have graphed production for the state of Ohio. Production in this state remains strong through May at 882,000 st. Production had reached a 13-month high back in March at 890,000 st. The May rate is in line with 3MMA levels seen one year ago.
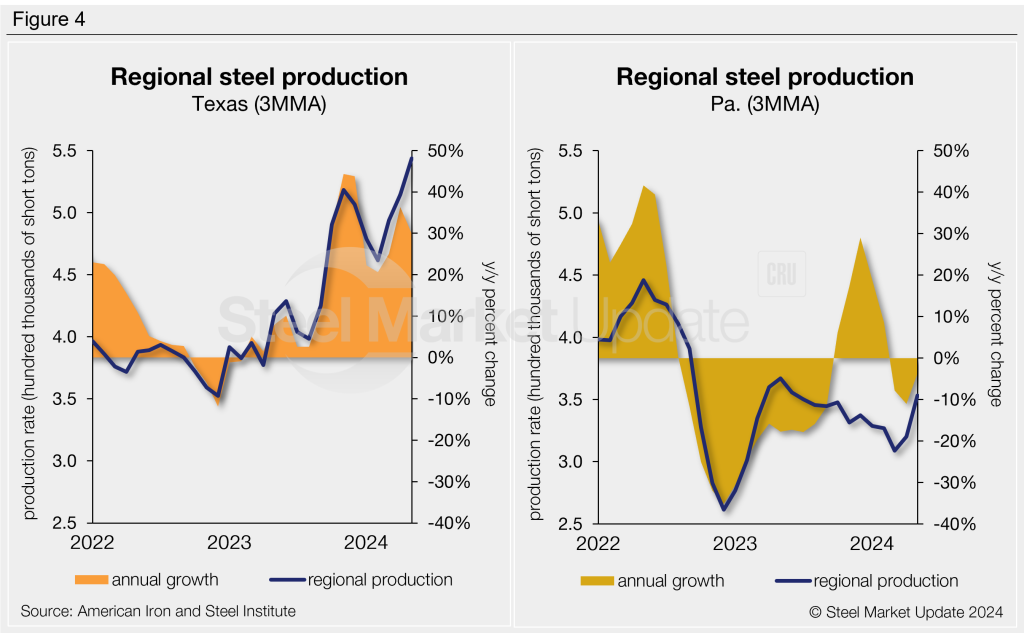
On the left side of Figure 4 we graph the 3MMA production rate for Texas. Production has surged over the last year due to additional capacity coming online from new mill construction. The May 3MMA is now up to a record high of 544,000 st.
The right graph in Figure 4 shows production for the state of Pennsylvania. 3MMA production in this state jumped to an 11-month high of 353,000 st in May. Prior to May, mill output had trended downwards for nearly one year straight. Production is down 4% compared to the same period last year.
Capacity utilization
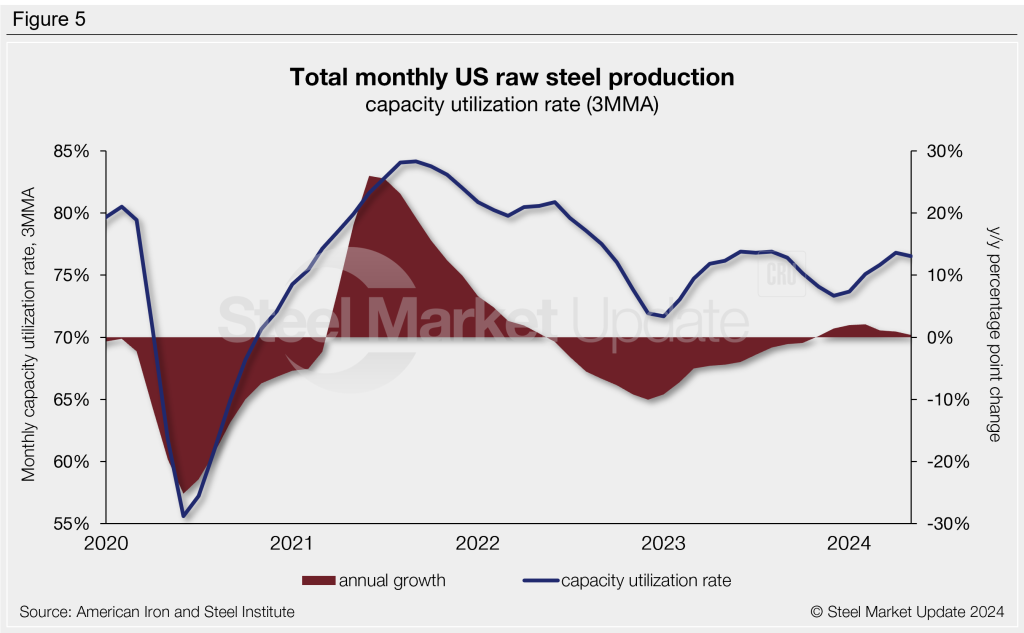
The average mill capacity utilization rate for May was 76.9%, up from 75.9% in April and up from 76.3% one year ago. The average capacity utilization rate for the year is now 76.1%, up from 75.4% in the first five months of 2023.
On a 3MMA basis, the capacity utilization rate through May eased to 76.5%, down 0.3 percentage points from the month prior but in line with levels seen this time last year. As shown in Figure 5, the 3MMA utilization rate remains strong side compared to what we have seen over the past year and a half.
An interactive history of monthly raw steel production is available here on our website.