Features
Active rig counts ease in US, rise in Canada
Written by Brett Linton
July 12, 2024
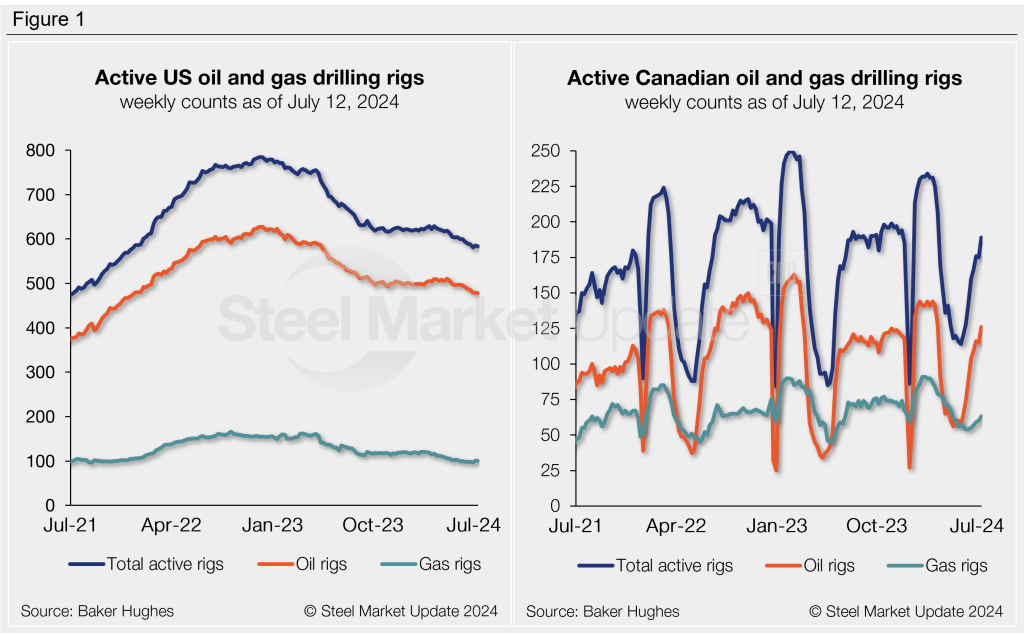
US drill rig activity resumed its downward trend last week, while Canadian counts increased to a four-month high, according to the latest data release from Baker Hughes.
US rigs
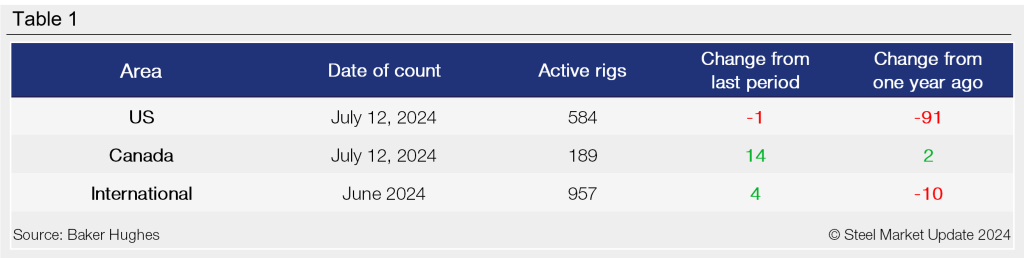
In the week ended July 12, the number of active drilling rigs in the US fell by one week over week to 584. Oil rigs declined by one to 478, gas rigs fell by one to 100, and miscellaneous rigs rose by one to six.
There were 91 fewer active US rigs compared to the same week last year. The number of active oil rigs is down by 59, gas rigs are down by 33, and miscellaneous rigs are up by one.
Canada rigs
The number of rigs operating in Canada increased by 14 last week to 189. Oil rigs rose by 11 to 126 and gas rigs increased by three to 63. This is the highest Canadian count recorded since mid-March.
This week there are two more active drilling rigs in Canada than there were one year ago. Oil rigs are up by 12 and gas rigs are up by 10.
International rig count
The international rig count is updated monthly. The total number of active rigs for the month of June rose to 957, up by four from May and down by 10 from levels one year prior.
The Baker Hughes rig count is important to the steel industry because it is a leading indicator of demand for oil country tubular goods (OCTG), a key end market for steel sheet. A rotary rig rotates the drill pipe from the surface to either drill a new well or sidetrack an existing one. For a history of the US and Canadian rig counts, visit the rig count page on our website.
Brett Linton
Read more from Brett LintonLatest in Features
Final Thoughts
We had an October surprise here at SMU on Wednesday. I was working from the CRU office in Pittsburgh, and the internet connection briefly went out. As luck would have it, that happened smack in the middle of a live Community Chat webinar. Fortunately, my colleague David Schollaert stepped in, Zekelman Industries CEO Barry Zekelman rolled with the punches – and the show went on. Could there be any more October surprises in store for us and for the steel market?
Apparent steel supply eases in August
The volume of finished steel entering the US market declined in August from July, according to SMU’s analysis of data from the US Department of Commerce and the American Iron and Steel Institute (AISI). Referred to as ‘apparent steel supply,’ we calculate this monthly rate by combining domestic steel mill shipments and finished US steel imports and deducting total US steel exports.
SMU Community Chat: Barry Zekelman champions domestic steel
Domestic steel champion Barry Zekelman joined SMU to discuss the latest issues impacting the US steel market.
SMU Community Chat replay now available
The latest SMU Community Chat webinar reply is now available on our website to all members. After logging in at steelmarketupdate.com, visit the community tab and look under the “previous webinars” section of the dropdown menu. All past Community Chat webinars are also available under that selection. If you need help accessing the webinar replay, or if your company […]
Steel market chatter this week
Prices, demand, inventories, evolving market events... What are buyers and sellers of steel talking about this week?