Market Data
July 5, 2024
Manufacturing indicators hold steady through May
Written by Brett Linton
Editor’s note: Steel Market Update is pleased to share this Premium content with Executive members. For information on how to upgrade to a Premium-level subscription, contact Luis Corona at luis.corona@crugroup.com.
Data on US industrial production, capacity utilization, new orders, and inventories all held steady through the latest figures, indicating a stable and healthy manufacturing sector. The strength of the manufacturing economy has a direct bearing on the health of the steel industry.
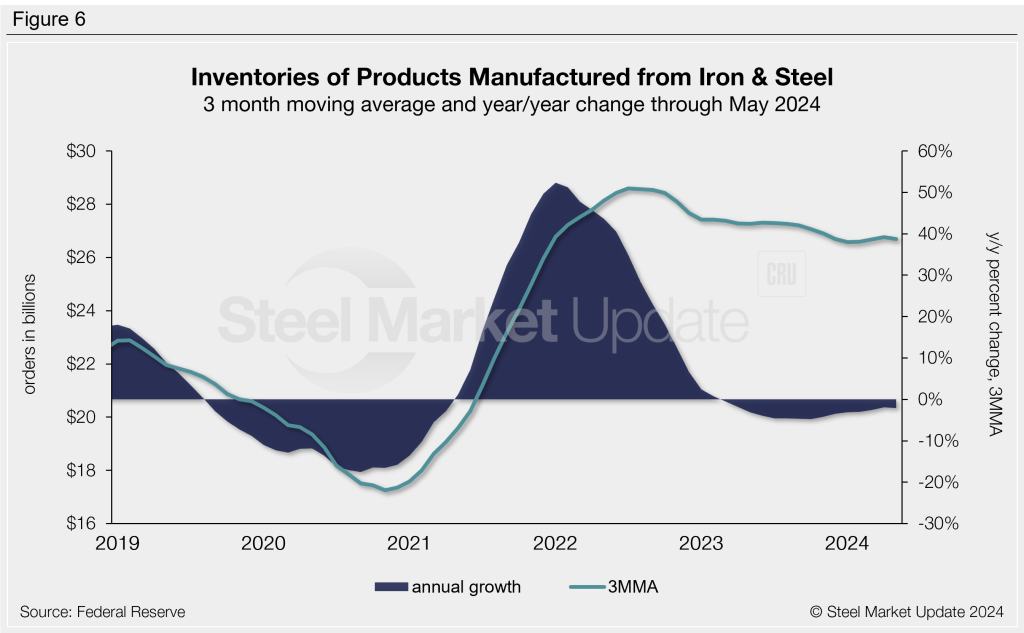
Industrial production
The Industrial Production (IP) index is a gauge for factory, mine, and utility output. Figure 1 shows the IP index since 2019, graphed as a three-month moving average (3MMA) to smooth out some of the monthly variability. As a 3MMA, the IP index has bobbed in the 102-103 range for the past two years. The latest reading is up to 102.7 through May, one of the highest levels seen so far this year, but down 0.3% from this time last year.
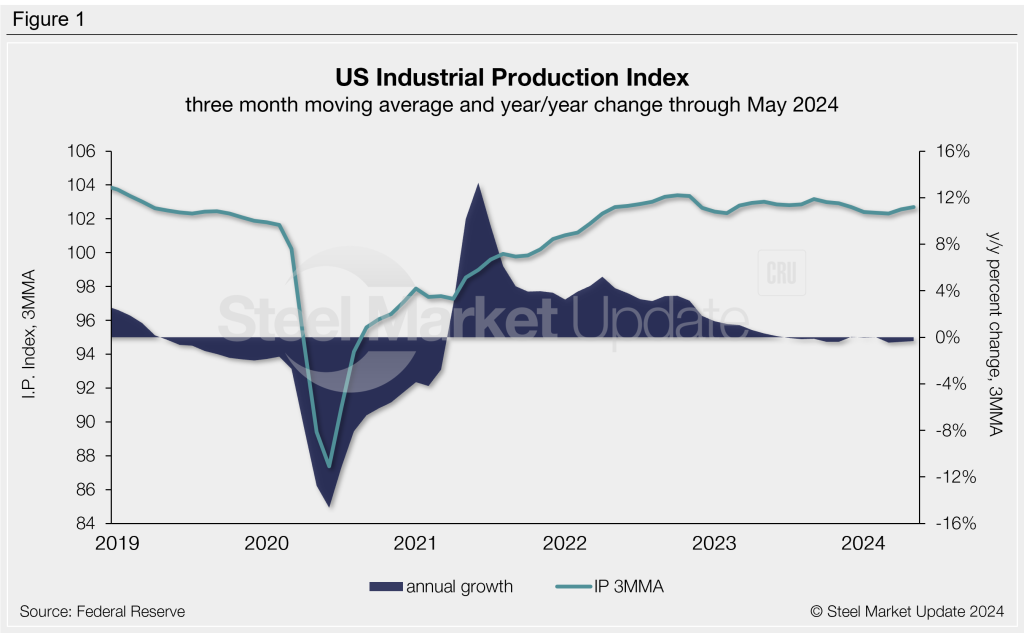
Manufacturing capacity utilization
Manufacturing capacity utilization through May was measured at 77.3% as a 3MMA. This rate has seen very little change across 2024 and is one of the lowest measures recorded in the last three years. In 2023 we saw an average rate of 77.8% vs. 79.2% in 2022 and 77.1% in 2021. Capacity utilization continues to remain above recessionary territory, as it has done since late-2020. For reference, capacity utilization had hovered around 74–78% for most of the 2010s, stalling in April 2020 to reach a low of 65.8% in June 2020 (Figure 2).
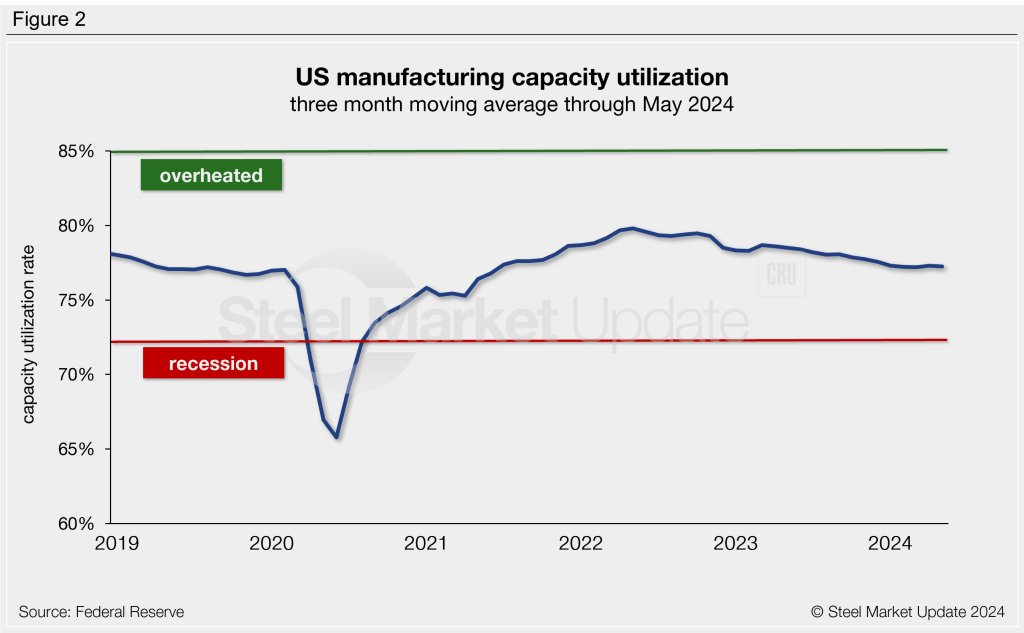
New orders for durable goods
New orders for durable goods are an early indicator of consumer and business demand for US manufactured goods. 3MMA levels continue to recover from the 2020 shock, with positive annual growth having occurred each month from December 2020 through April of this year. New orders are at $282.7 billion as a 3MMA through May, down 0.5% annually and the first negative growth rate seen since 2020.
New orders for manufactured products
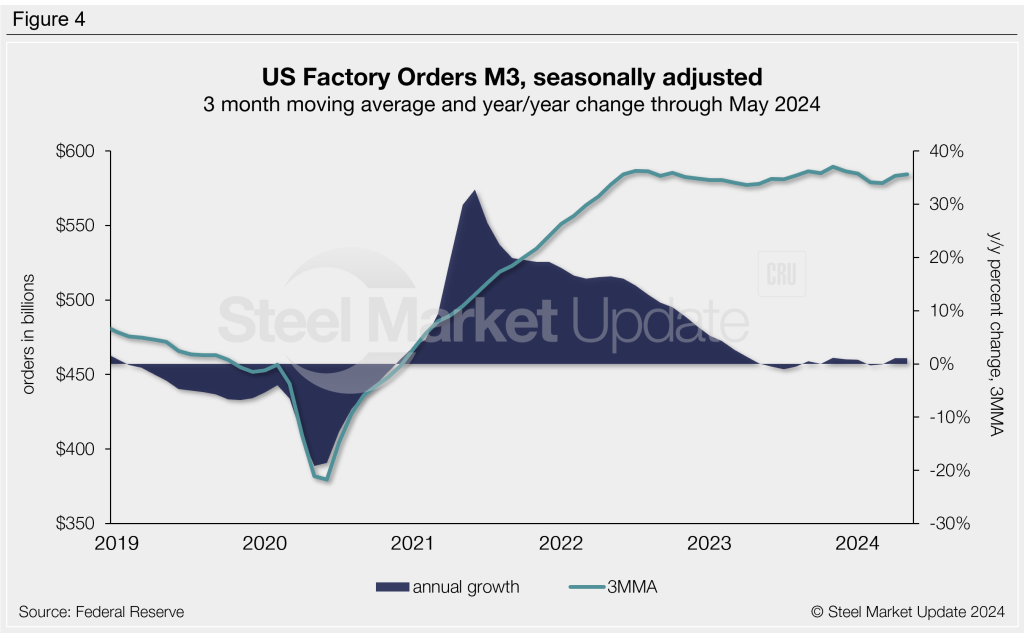
As reported by the Census Bureau, the growth rate of new orders for manufactured products was historically strong in 2021 and 2022. The growth rate stabilized entering 2023 and has remained flat since. While growth has been relatively stable, the value of factory orders remains near historical highs. The highest 3MMA level in our 30-year data history was recorded last November at $589 billion (Figure 4). The 3MMA through May is down slightly to $584 billion, up 1.1% compared to levels one year earlier.
New orders for products manufactured from iron and steel
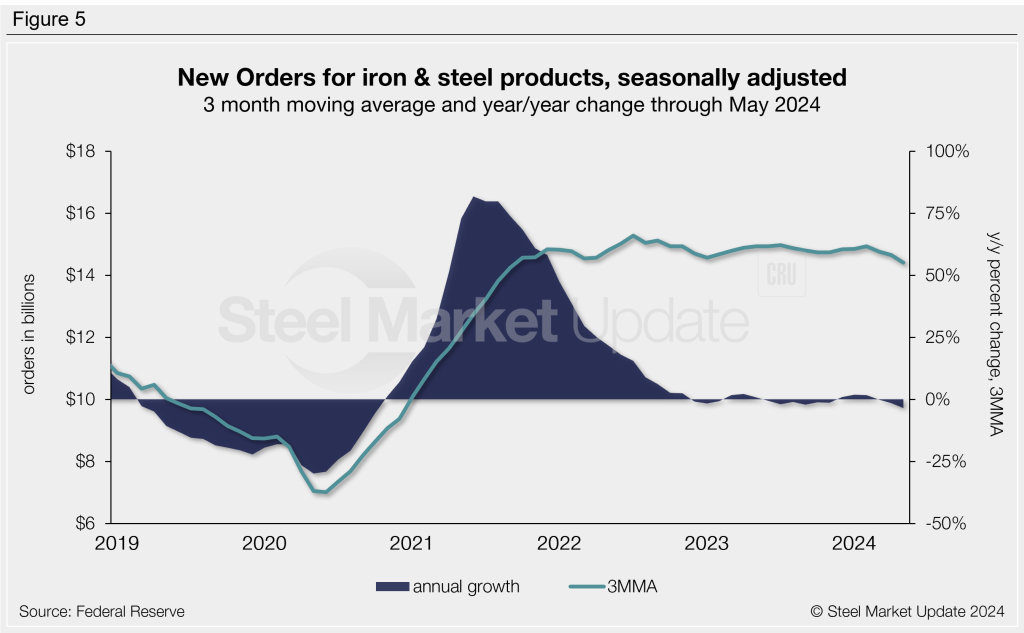
Within the Census Bureau M3 manufacturing survey is a subsection for iron and steel products. Figure 5 shows the history of new orders for iron and steel products as a 3MMA. The 3MMA new order level remains strong at $14.4 billion through January. New orders have been in this ballpark since late-2021, having reached a record high 3MMA of $15.3 billion in July 2022. The year-over-year growth rate through May is -3.5%. This rate has fluctuated around zero since late-2022, having steadily declined from the 11-year high of 81.8% in June 2021.
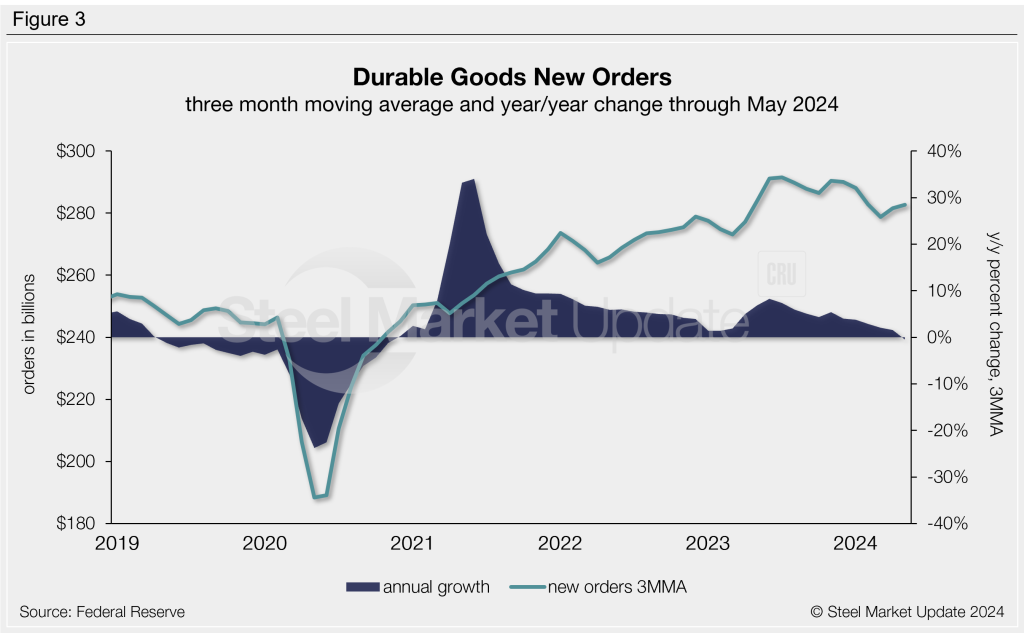
Inventories of products manufactured from iron and steel
Inventories of iron and steel products broke their multi-month increase streak in mid-2022, gradually declining since then. The annual growth rate 3MMA reached a 31-month low of -4.7% in late 2023, but has marginally eased throughout 2024. The latest iron and steel inventory levels totaled $26.7 billion on a 3MMA basis through May, down 2.1% compared to the same period the year prior (Figure 6).