Mexico
June 27, 2024
HR futures: 'Gimme Shelter'
Written by Dave Feldstein
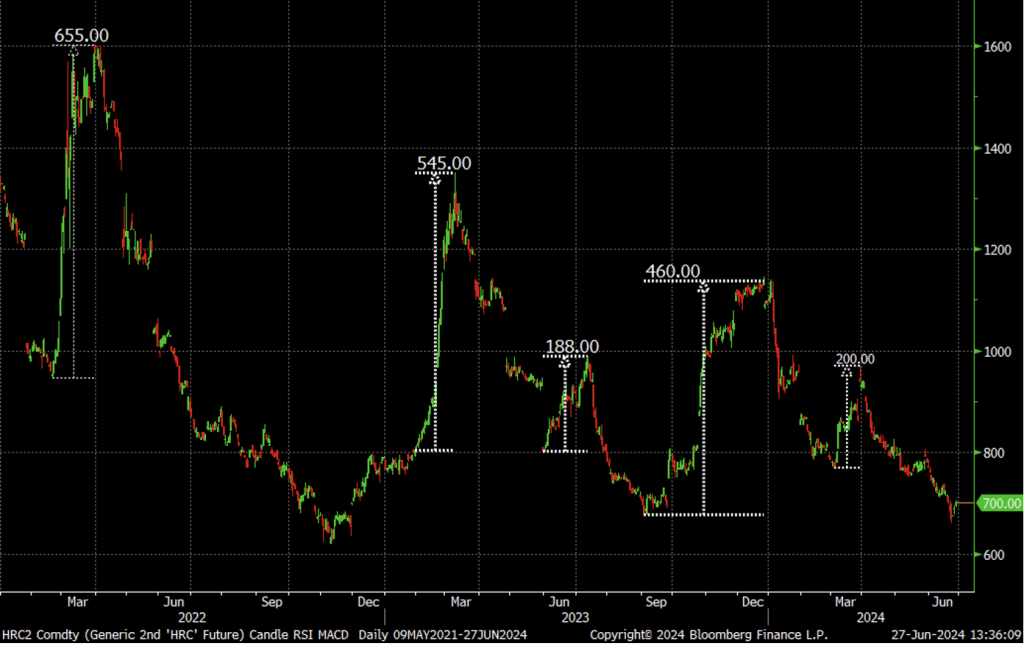
This chart of the rolling second-month CME hot-rolled coil (HRC) future dating back to the start of 2022 has been as volatile as a herd of “Wild Horses.” The futures market has seen steep sell-offs followed by rallies that “Rip This Joint.” March 22’s $655 rally, March 23’s $545 rally, June 23’s $188 rally, Q4’23’s $460 rally and then the $200 rally in March. These were followed by sharp round trips lower and even larger declines for some. In fact, the futures started 2024 with a sharp $175 decline in the first seven trading days of the year.
Rolling 2nd month CME hot-rolled coil future $/st
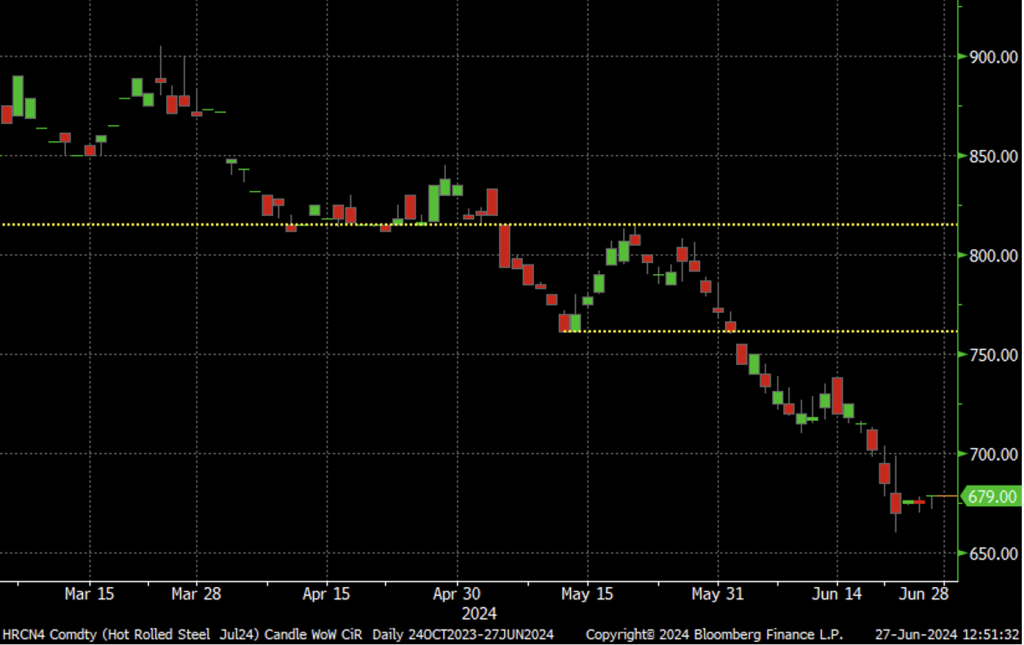
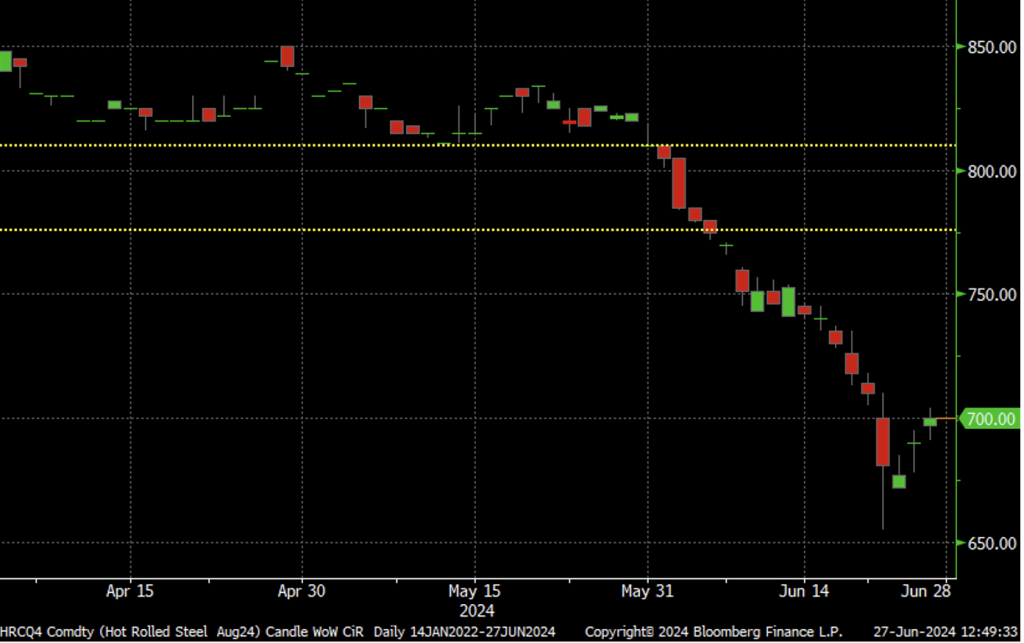
After another $200 round trip from early March to late April, futures seemed to calm down, trading flat and holding above the $815 support level. Then Nucor’s surprise $760 Consumer Spot Price (CSP) price announcement on May 6 pulled futures below this support level down to $760. From there, the July future bounced back up to $815, finding resistance at the old support level. After that two-week rally failed in the last week of May, the July future broke below its $760 low in what felt like its “19th Nervous Breakdown.”
July CME hot-rolled coil future $/st
Throughout the quarter, commercial buyers held between 225,000 and 275,000 tons. Meanwhile, commercial sellers wound down roughly 10% of their short positions, perhaps taking profits. The swap dealer crowd, that is the commercial bank trading desks, have been long throughout Q2, with a small short position being taken off in the second week of June. The “managed money” crowd, formerly known as the speculators, have more than doubled their short position throughout the quarter. Speculators get a bad rap and are often the scape“Goats (Head Soup)” when markets tank, but they are an important player in the markets, providing it with much needed liquidity.
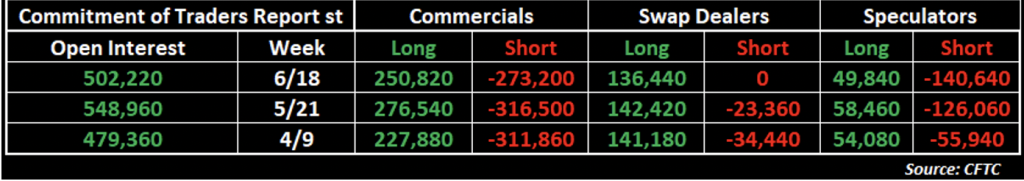
Commercial participant participation has slowed in recent years, while the noncommercial crowd has taken a much larger percentage of the daily trading volume. This could be due to the higher interest rates/capital costs or the relatively healthy physical market over the past few years.
There is no doubt service centers that have been hedging downside risk in the 2020s are in need of some kind of “Emotional Rescue.” I would argue there have been a few days and weeks, especially in March 2022, that got a little “Sticky (Fingers)” for the price risk managers. These periods where the futures spiked, squeezing the natural short hedgers, also shook many commonly held beliefs about capital requirements necessary to manage maintenance margin. Some of the firms might have realized they lacked the skill and expertise needed to execute an appropriate hedging strategy. Perhaps they realized that sometimes “You Can’t Always Get What You Want” and bailed.
The ramifications of the exit of those commercial hedgers can be seen in the HRC futures curve. When you look “All Down the Line” into Q1’25, there is a massive contango that exceeds the carrying costs of holding steel. On Tuesday, SMU published a $670 HRC price, which was roughly $110 below the October future, only four months out. Why is the curve’s contango so massive?
CME Midwest HRC futures curve $/st
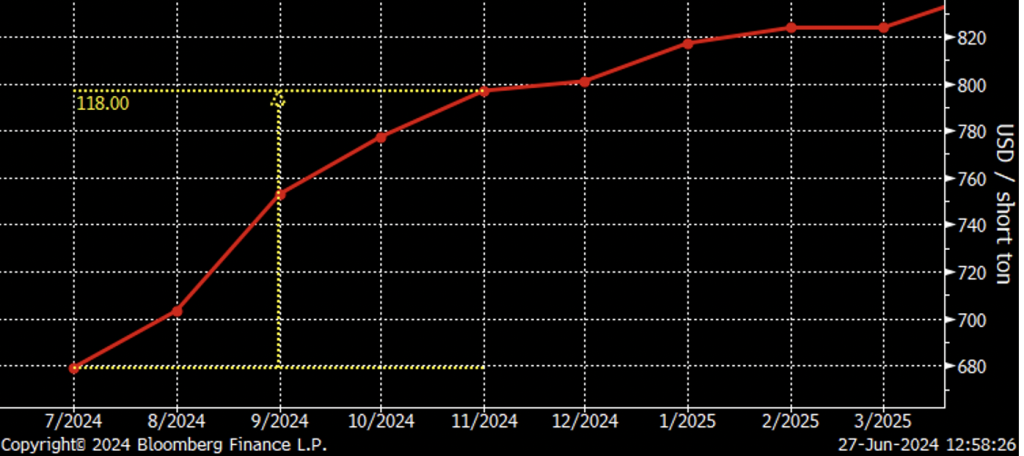
Perhaps it is due to the lack of these commercial participants selling futures against their physical inventory. However, can you blame these hedgers? They have been badly burned on multiple occasions. Nevertheless, those hedgers sitting on the sidelines have missed 2024’s “Good Times” and could be experiencing the “Summertime Blues.” While it is not my place to judge, perhaps to those commercials players I can say “You Gotta Move.” The same could be said for those hedging their buys/upside price risk as futures haven’t been this low since late 2022.
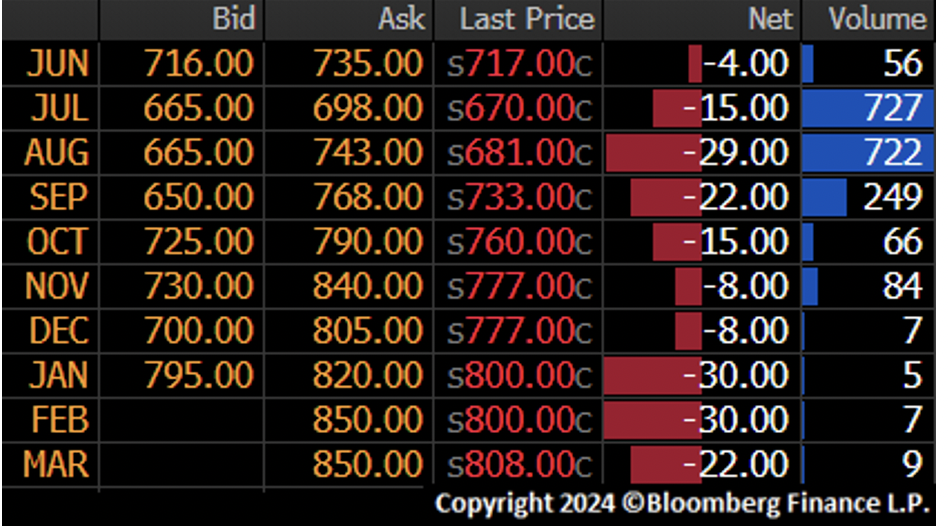
Support levels have been breaking down one after the other throughout the year. As we came into this week, the market started in the red. Then Nucor’s CSP announcement of $680 came Monday morning sending futures to new lows. It seems like the selling would continue all week and the market would just “Let it Bleed” into the end of the quarter. This shows HRC settlements on Monday.
It seemed like there was an “Exile on Main Street,” but in the last couple days it’s been more like a reversal on main street. Whether it is due to the strike at ArcelorMittal Mexico or simply profit taking by all those speculators, the futures are “Jumpin Jack Flash” higher. HRC volatility is no joke and from out of nowhere this mini-rally has been screaming “Start Me Up!”
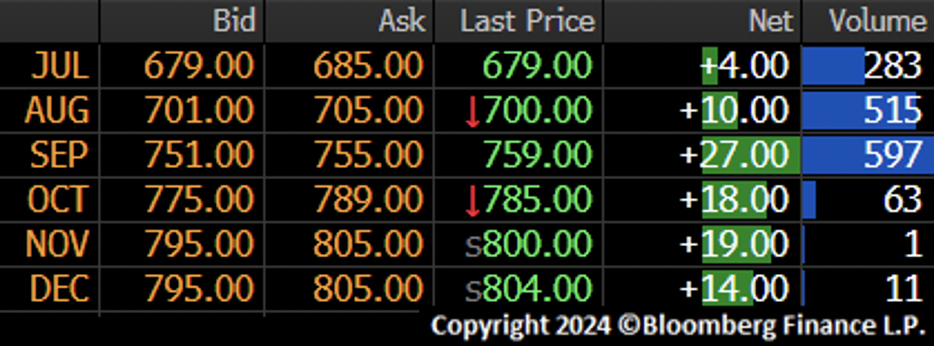
Now “I Got the Blues” along with the other commercial hedgers who have seen a good chunk of their P&L evaporate in just a couple of days. There were a number of quantitative measures indicating something has to give. The Relative Strength Index indicated futures were “oversold.” Still, the futures are the tail wagging the dog, so it is hard to tell if the rebound seen over the past couple trading sessions is due to technical traders and profit taking or if it is indicative of a floor for physical prices.
August CME hot-rolled coil future $/st
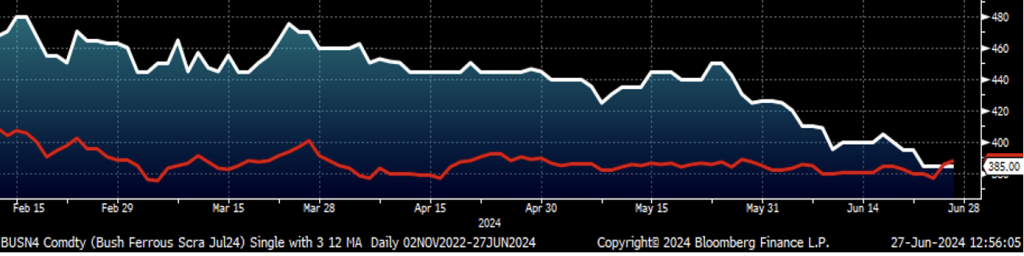
Another interesting part of the story is on the raw materials side. The July Turkish scrap future is trading above the July busheling future. Also, NOLA pig iron was at $470 at the end of last week. Can these price relationships be indicating a floor for busheling perhaps?
Rolling 2nd month CME HRC future $/st (wh) and Weekly Midwest Index (red)
Why would a mill buy pig iron when it is $85 higher than busheling? Why would a mill buy shred when busheling provides a much higher yield? Assuming busheling in fact finds support around the current price level, then the mill’s profit margins will start to get skinny if the price of HRC continues to fall much further. From $900 to $800 I heard some folks talking about the possibility of a furnace being idled to tighten supply and for the price to “Stop Breaking Down.” Now that the price is below $700 and profit margins are actually at the risk of being in the red, will a mill or mills take actions to “Paint it Black”?
So many questions, such little time. Has the bottom been established for HRC futures? Or will we see this rally reverse lower as we did in the July future at the end of May (see above)? HRC futures can feel like gambling, as if trading HRC futures is no different than “Tumbling Dice.” It is a fight day in and day out; why do you think it’s called “Rock” trading??? The HRC virtual pit is not for the faint of heart, but rather for a real “Street Fighting Man.”
You may be wondering, what is with all of the Rolling Stones songs woven into this article? Trading HRC futures is exciting, but not as exciting as going to see the Rolling Stones play Soldier Field tonight!!!
You might be thinking, “Why are you telling me this?”
Why am I telling you this???
Cause I’m telling everybody!!!!!
Disclaimer: The content of this article is for informational purposes only. The views in this article do not represent financial services or advice. Any opinion expressed by Mr. Feldstein should not be treated as a specific inducement to make a particular investment or follow a particular strategy, but only as an expression of his opinion. Views and forecasts expressed are as of date indicated, are subject to change without notice, may not come to be and do not represent a recommendation or offer of any particular security, strategy or investment. Strategies mentioned may not be suitable for you. You must make an independent decision regarding investments or strategies mentioned in this article. It is recommended you consider your own particular circumstances and seek the advice from a financial professional before taking action in financial markets.