Prices

May 30, 2024
HR futures: Waiting for a new trend to emerge
Written by Gaby Ain
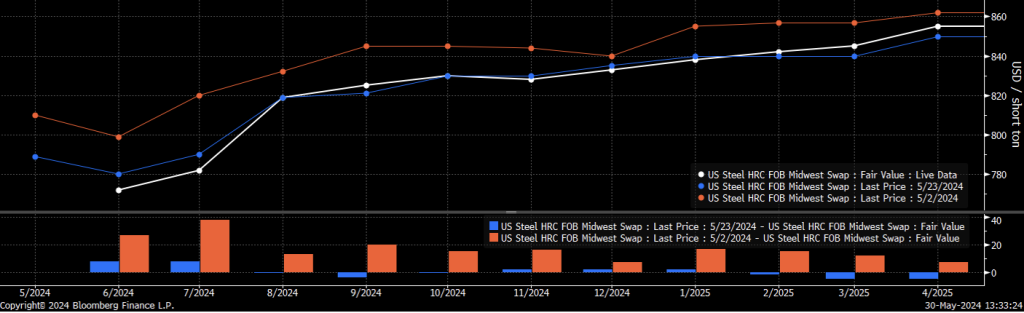
Week over week, the futures curve saw minimal change. In the chart below, we compare last week (blue) to today (white). The overall shape remains consistent, indicating an unchanged market view—with the first two months (June and July) slightly lower, while September ticked up and is still pricing in a bottom in June. Looking back a month (red), the overall curve has a similar shape, but has notably shifted downward. A reasonable conclusion for a shift rather than a change in shape is because the market is being driven by demand, which has been soft, or certainly softer than anticipated going into the spring.
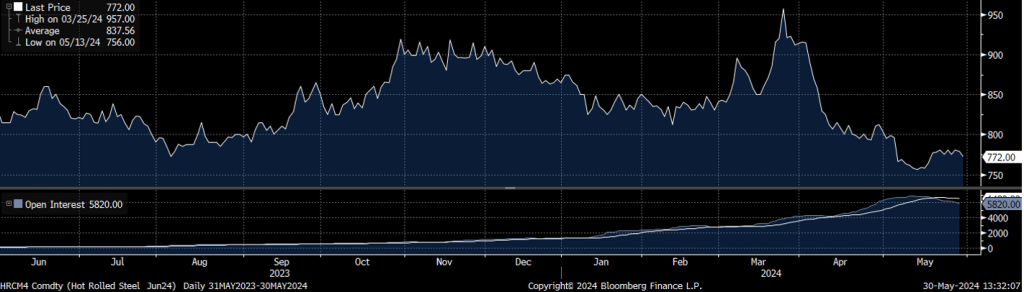
Furthermore, the chart below shows pricing for the current active month (June), which traded at its lowest level on record ($756) on May 13. Interestingly, if we disregard the brief drop and recovery, today’s close for the June contract would be its all-time low. This bottom also coincides with when open interest peaked, showing that market participants started closing down positions.
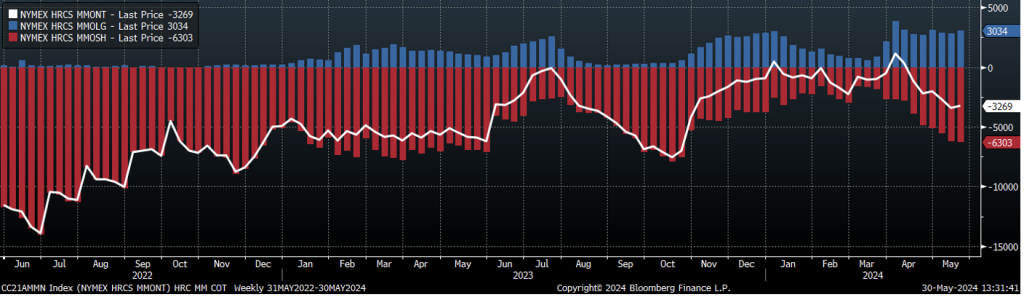
Continuing along with open interest, an interesting development emerged over the week with Money Managers (below). They now represent 7% of total open interest, their highest share since November 2023. Although they remain net short (white line), a divergence is occurring between their long (blue) and short (red) positions. Long positions have held up at levels last seen in January, while short positions are approaching levels from October 2023. This simultaneous growth in long and short positions underscores the fact that the most speculative participants have not only increased activity, but strongly hold differing market perspectives – resulting in increased overall uncertainty of market direction.
Finally, and inevitably, all bright beginnings eventually fade, as the novelty wears off and the new becomes the everyday with Nucor’s weekly price, the Consumer Spot Price (CSP). From its conception to now, the front of the futures curve clearly awaits the Monday release, whereas in the physical market it may be losing luster. This reverts to what is happening in the fundamentals, which indicate soft demand. Domestic lead times are so-so, spot pricing continues to slide, and steel-sector specific economic data has been disappointing. All of this with currently elevated levels of profitability. Inventories are healthy, further signaling that there is not enough demand to chew through the flood of imports and the up-ticking domestic production levels. Thus, the divergence in physical and financial may be due to the upcoming stalemate we are approaching. Mills are saying they are comfortable with orders, while buyers are saying they are comfortable with their inventories. These two narratives can only coexist for a brief period. It is just a matter of time before one “blinks first” and a new trend emerges.
Disclaimer: The content of this article is for informational purposes only. The views in this article do not represent financial services or advice. Any opinion expressed by Flack Global Metals or Flack Metal Bank should not be treated as a specific inducement to make a particular investment or follow a particular strategy, but only as an expression of his opinion. Views and forecasts expressed are as of date indicated, are subject to change without notice, may not come to be and do not represent a recommendation or offer of any particular security, strategy or investment. Strategies mentioned may not be suitable for you. You must make an independent decision regarding investments or strategies mentioned in this article. It is recommended you consider your own particular circumstances and seek the advice from a financial professional before taking action in financial markets.