Market Data
April 15, 2024
March service center shipments and inventories report
Written by Estelle Tran
Flat Rolled = 58.3 shipping days of supply
Plate = 60.6 shipping days of supply
Flat Rolled
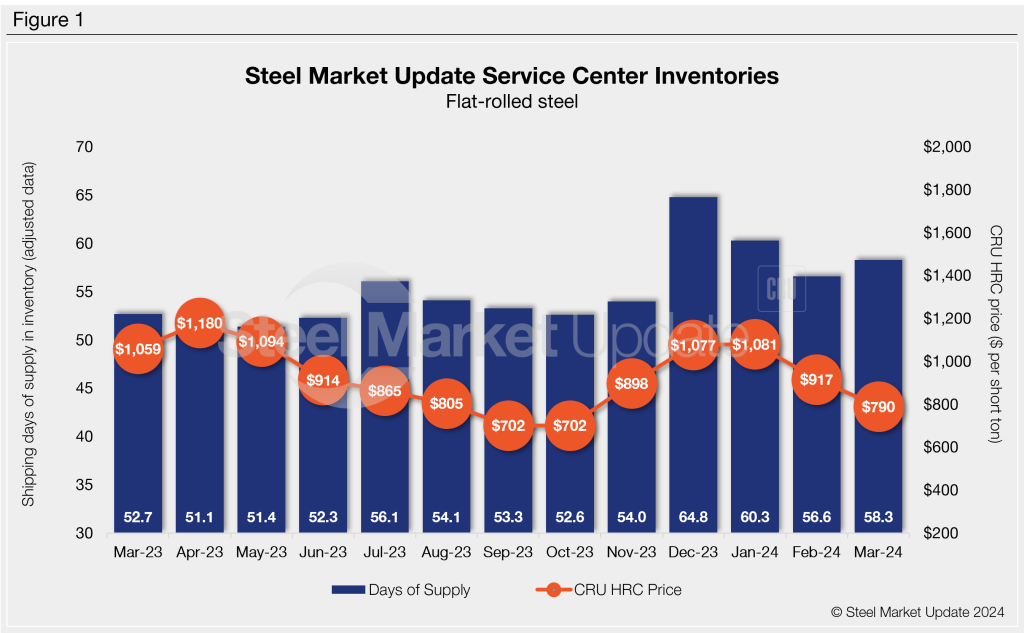
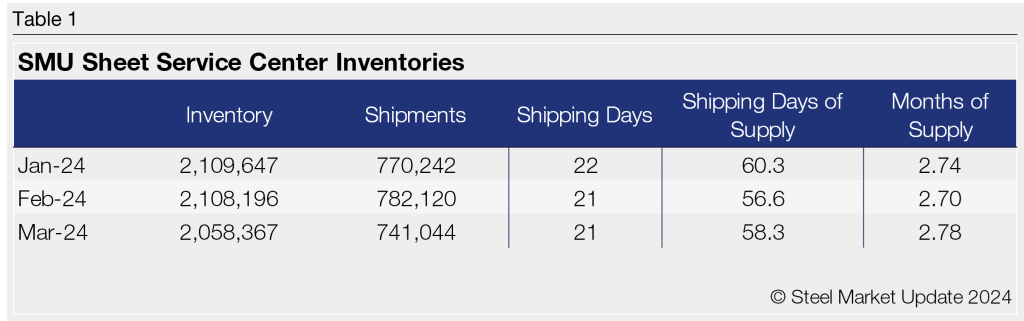
US service center flat-rolled steel inventories edged up in March as shipments remained low. At the end of March, service centers carried 58.3 shipping days of supply on an adjusted basis, up from 56.6 shipping days in February. Flat-rolled steel supply was also up y/y from 52.7 shipping days in March 2023. Inventories also rose slightly in terms of months of supply to 2.78 months in March from 2.7 months in February.
Most service centers had 21 shipping days in March, though some companies had 20 shipping days with the Easter holiday. February also had 21 shipping days. The lower shipments in March could be a sign that demand is still weak or that service center customers were also destocking last month.
Flat-rolled steel prices reached a bottom in mid-March. At about the same time, hot-rolled coil lead times hit their lowest level at 4.93 weeks, according to the March 13 SMU survey data. Prices and lead times have been on the upswing since. The April 10 SMU survey pegged HRC lead times at 5.3 weeks.
In March, the amount of flat-rolled steel on order rose with opportunistic, large-volume deals at the bottom of the market. At the end of March, service centers saw shipping days of supply on order up vs. February. Flat-rolled steel inventories on order saw a notable boost m/m in March.
Inventories combined with material on order indicate ample supply relative to demand levels. In the latest SMU survey, 68% of service centers said customer releases were flat y/y, 23% said they were releasing less steel y/y, and 9% said they were shipping more. Service centers continue to report weaker-than-expected demand so far this year.
Plate
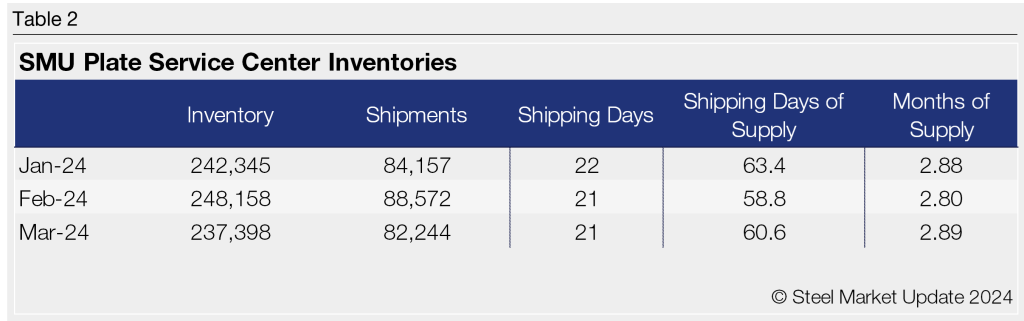
With demand still slow, US service centers’ plate supply increased in March. At the end of the month, service centers carried 60.6 shipping days of plate supply, up from 58.8 shipping days of supply in February. Plate inventories represented 2.89 months of supply in March, up from 2.8 months of supply in February. In March 2023, service centers stocked 41.0 shipping days of plate supply.
Market contacts said demand remains relatively weak, and mills have been eager to make deals. At the same time, plate mills have been trying to control production, which has helped to pull back on the recent w/w price declines. SMU’s April 10 survey recorded plate mill lead times at 5.92 weeks, up from 5.41 weeks a month ago.
The total volume of plate on order was up slightly in March, but with the lower daily shipping rate, the material on order represents more supply. At the end of March, service centers shipping days of plate supply on order was up vs. February. Plate inventories on order were also up m/m in March.
In January and February, plate intake at service centers exceeded shipments, but in March, intake fell back below shipment levels. While the total volume of plate in inventory declined m/m, it is still up significantly y/y and represents much more supply with the low daily shipping rate. The amount of plate in inventory and on order seems to be high relative to demand levels but could be in preparation for a seasonal demand uptick.