Analysis

June 14, 2022
Final Thoughts
Written by Michael Cowden
Sheet prices are falling at the fastest clip we’ve seen since before the war in Ukraine. Let’s call it the great rewind.
But where are we rewinding to – earlier this year or 2019, the last “normal” market we had before the disruptions caused by the pandemic and the war?
First come context: SMU’s average hot-rolled coil price is $1,100 per ton ($55 per cwt) this week, down $90 per ton from a week ago. That’s the biggest week-over-week decline we’ve seen since mid-February, before the war, when prices fell $110 per ton in a week.
The narrative about what’s happening now should be familiar to most of you by now: The war in Ukraine sent prices rocketing higher in March at the fastest rate we’ve ever seen, spurred on by fears of shortages of basic steelmaking raw materials like pig iron. While the human tragedy has only gotten worse, the market – as markets tend to do – has adapted more quickly than expected. And with the initial panic gone, we are working on the question we didn’t find an answer to in February – where is the bottom?
We saw HRC prices fall, on average, as low as $1,000 per ton then. SMU publishes an average price, and our low end was below that. The low end of our current range is already approaching that $1,000-per-ton threshold. The big question is whether it will go lower for all but the biggest buyers or whether mills will “hold the line” – a concept I’m not entirely sure I believe in.
It’s easy to maintain “discipline” in a rising market. It’s not so easy in a falling market, when mills and service centers have to compete on price. That’s the case now. I think everyone can agree on that. I know some of you are wondering why demand has slowed down. And others are still very active. But that activity is now taking place at a lower price point.
My question really isn’t whether we’ve rewound to Q1, before the war. I think it’s safe to say that we have. My question is whether we’re going to see prices more in line with what we saw in 2019, a comparatively normal time for steel.
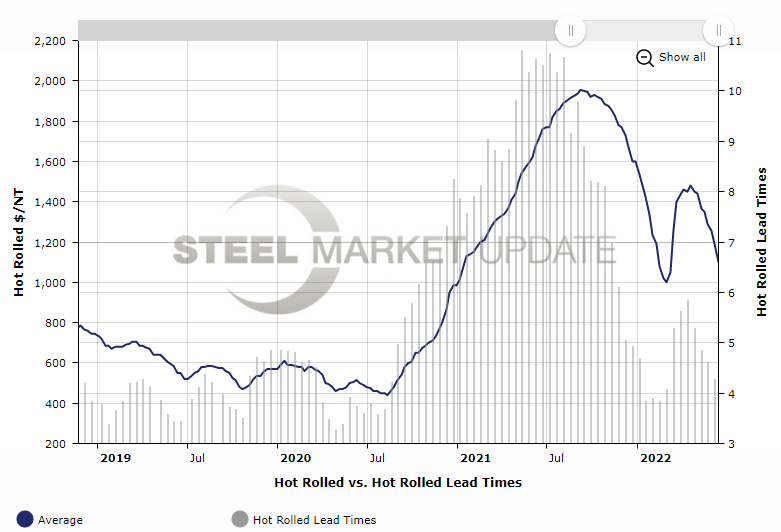
I don’t need to do the math for you on what that might mean. Let’s just take a look at the chart below. The blue line is HRC prices. The gray line is HRC lead times. (You can recreate this chart yourself on our website.)
Suffice it to say that – pre-pandemic and pre-Ukraine war – we never saw HRC prices anywhere near as high as they are now with lead times hovering around four weeks.
Let’s remember, too, that we’ve seen this movie before. Or one like it.
HRC prices shot up to $915 per ton in July 2018 following the implementation of Section 232 tariffs. Prices that high seemed crazy at the time. But the market adjusted to the tariffs, and the tariffs themselves were dropped from Canada and Mexico. The result: HRC prices fell to $560 per ton in July 2019.
I’m not saying that’s where we’re going this time in absolute terms. What I’m suggesting is that we’re seeing the usual cyclicality – but that the cycles are bigger and faster than they used to be.
By Michael Cowden, Michael@SteelMarketUpdate.com


