

Market Data

November 15, 2021
September Shipments and Supply of Steel Products
Written by David Schollaert
Total mill shipments of steel products fell 12.2% in September to 8.502 million tons, after seeing an 11.1% increase the month prior. Apparent supply also slipped in September, down 6.9%, following a 7.9% increase in August. September’s contractions mark the first decrease in steel supply in seven months.
This analysis is based on steel mill shipment data from the American Iron and Steel Institute (AISI) and import-export data from the U.S. Department of Commerce (DOC). The analysis summarizes total steel supply by product from 2008 through September 2021 and year-on-year changes.
As market reports and fundamentals begin to display balance, the supply/demand differential has shifted, causing supply to charge ahead of demand as imports continue to stream into the domestic market. The result has a been a decrease in mill shipments and a steady but slow contraction is U.S. steel prices. Steel supplies – including domestic production and imports – have accelerated. Imports of finished steel jumped 17.4% in September when compared to the month prior, while domestic shipments slipped by 12.7% during the same period.
Domestic mill utilization remained around 85% on average through September, running near capacity, but the increase in imports and reduced demand in the automotive sector from the semiconductor chip shortage have slowed overall shipments. Lead times have contracted as a result, and steel prices have reached an inflection point, easing throughout the month.
SMU’s benchmark hot-rolled coil price range averaged $1,955 per net ton FOB mill at the beginning of September. Since then, prices have dipped by $100 per ton to an average of $1,855 as of Nov. 9. Raw steel production shown below in Figure 1 is based on weekly data from the AISI displayed as four-week moving averages through Sept. 25.
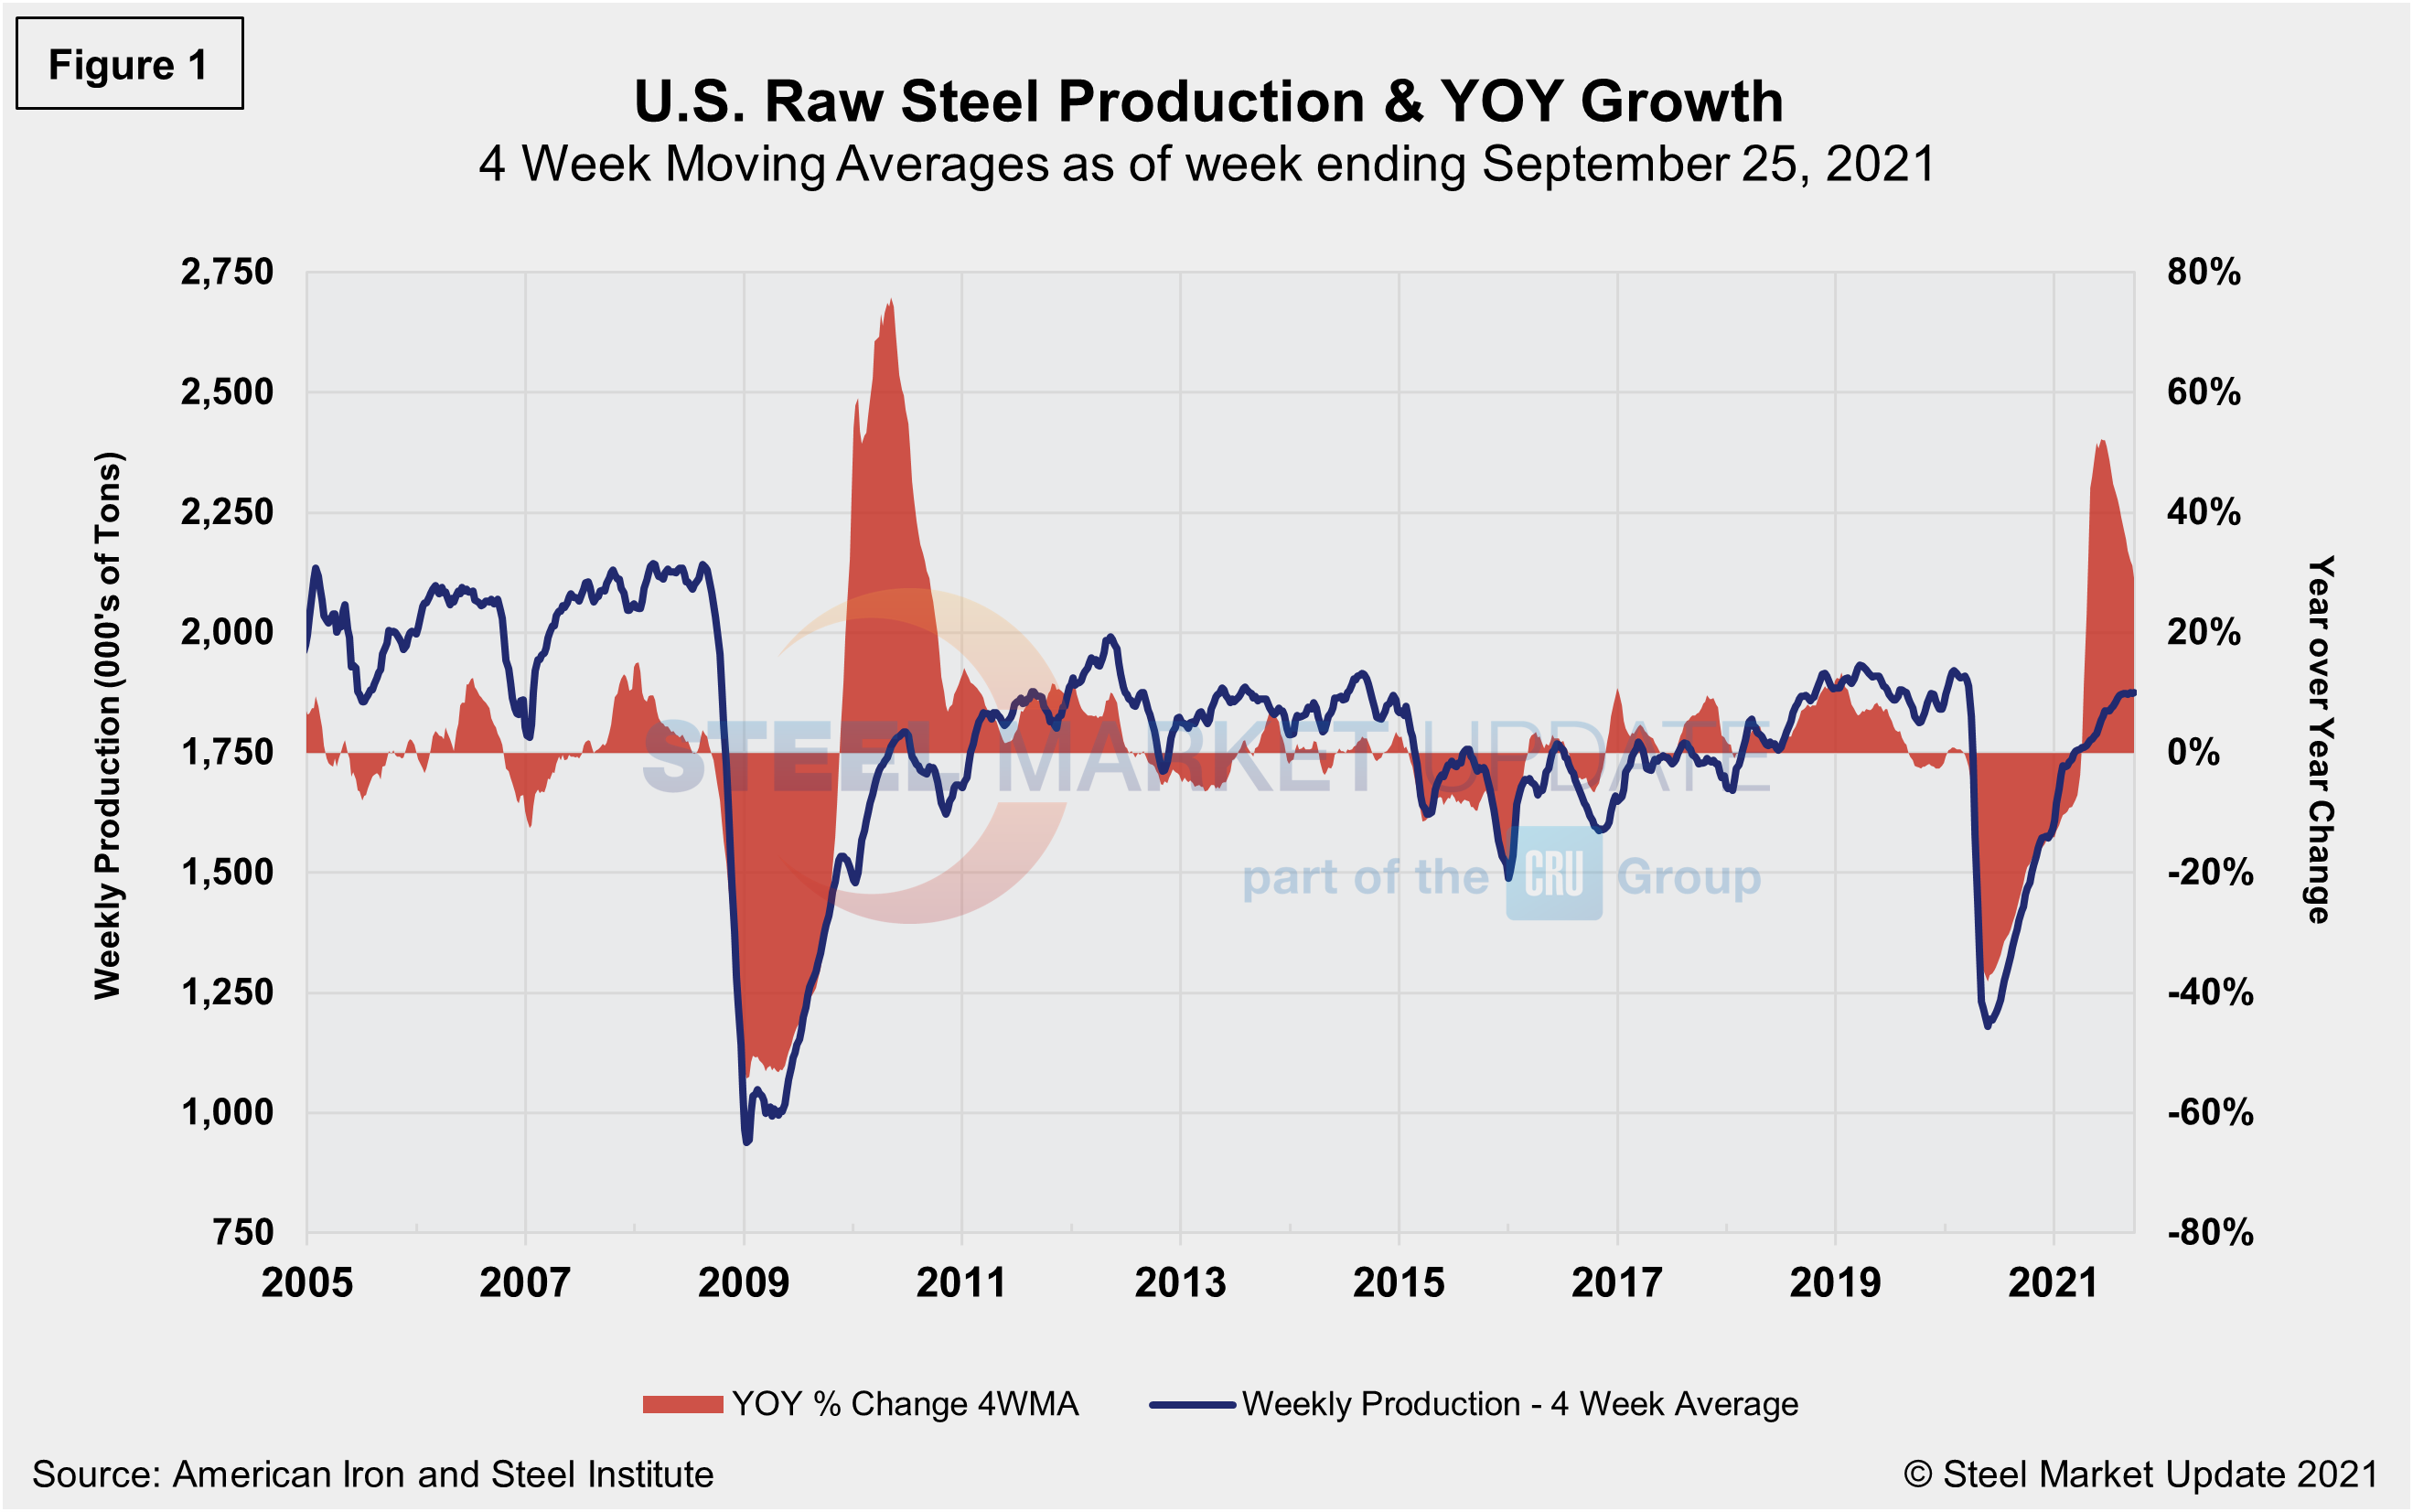
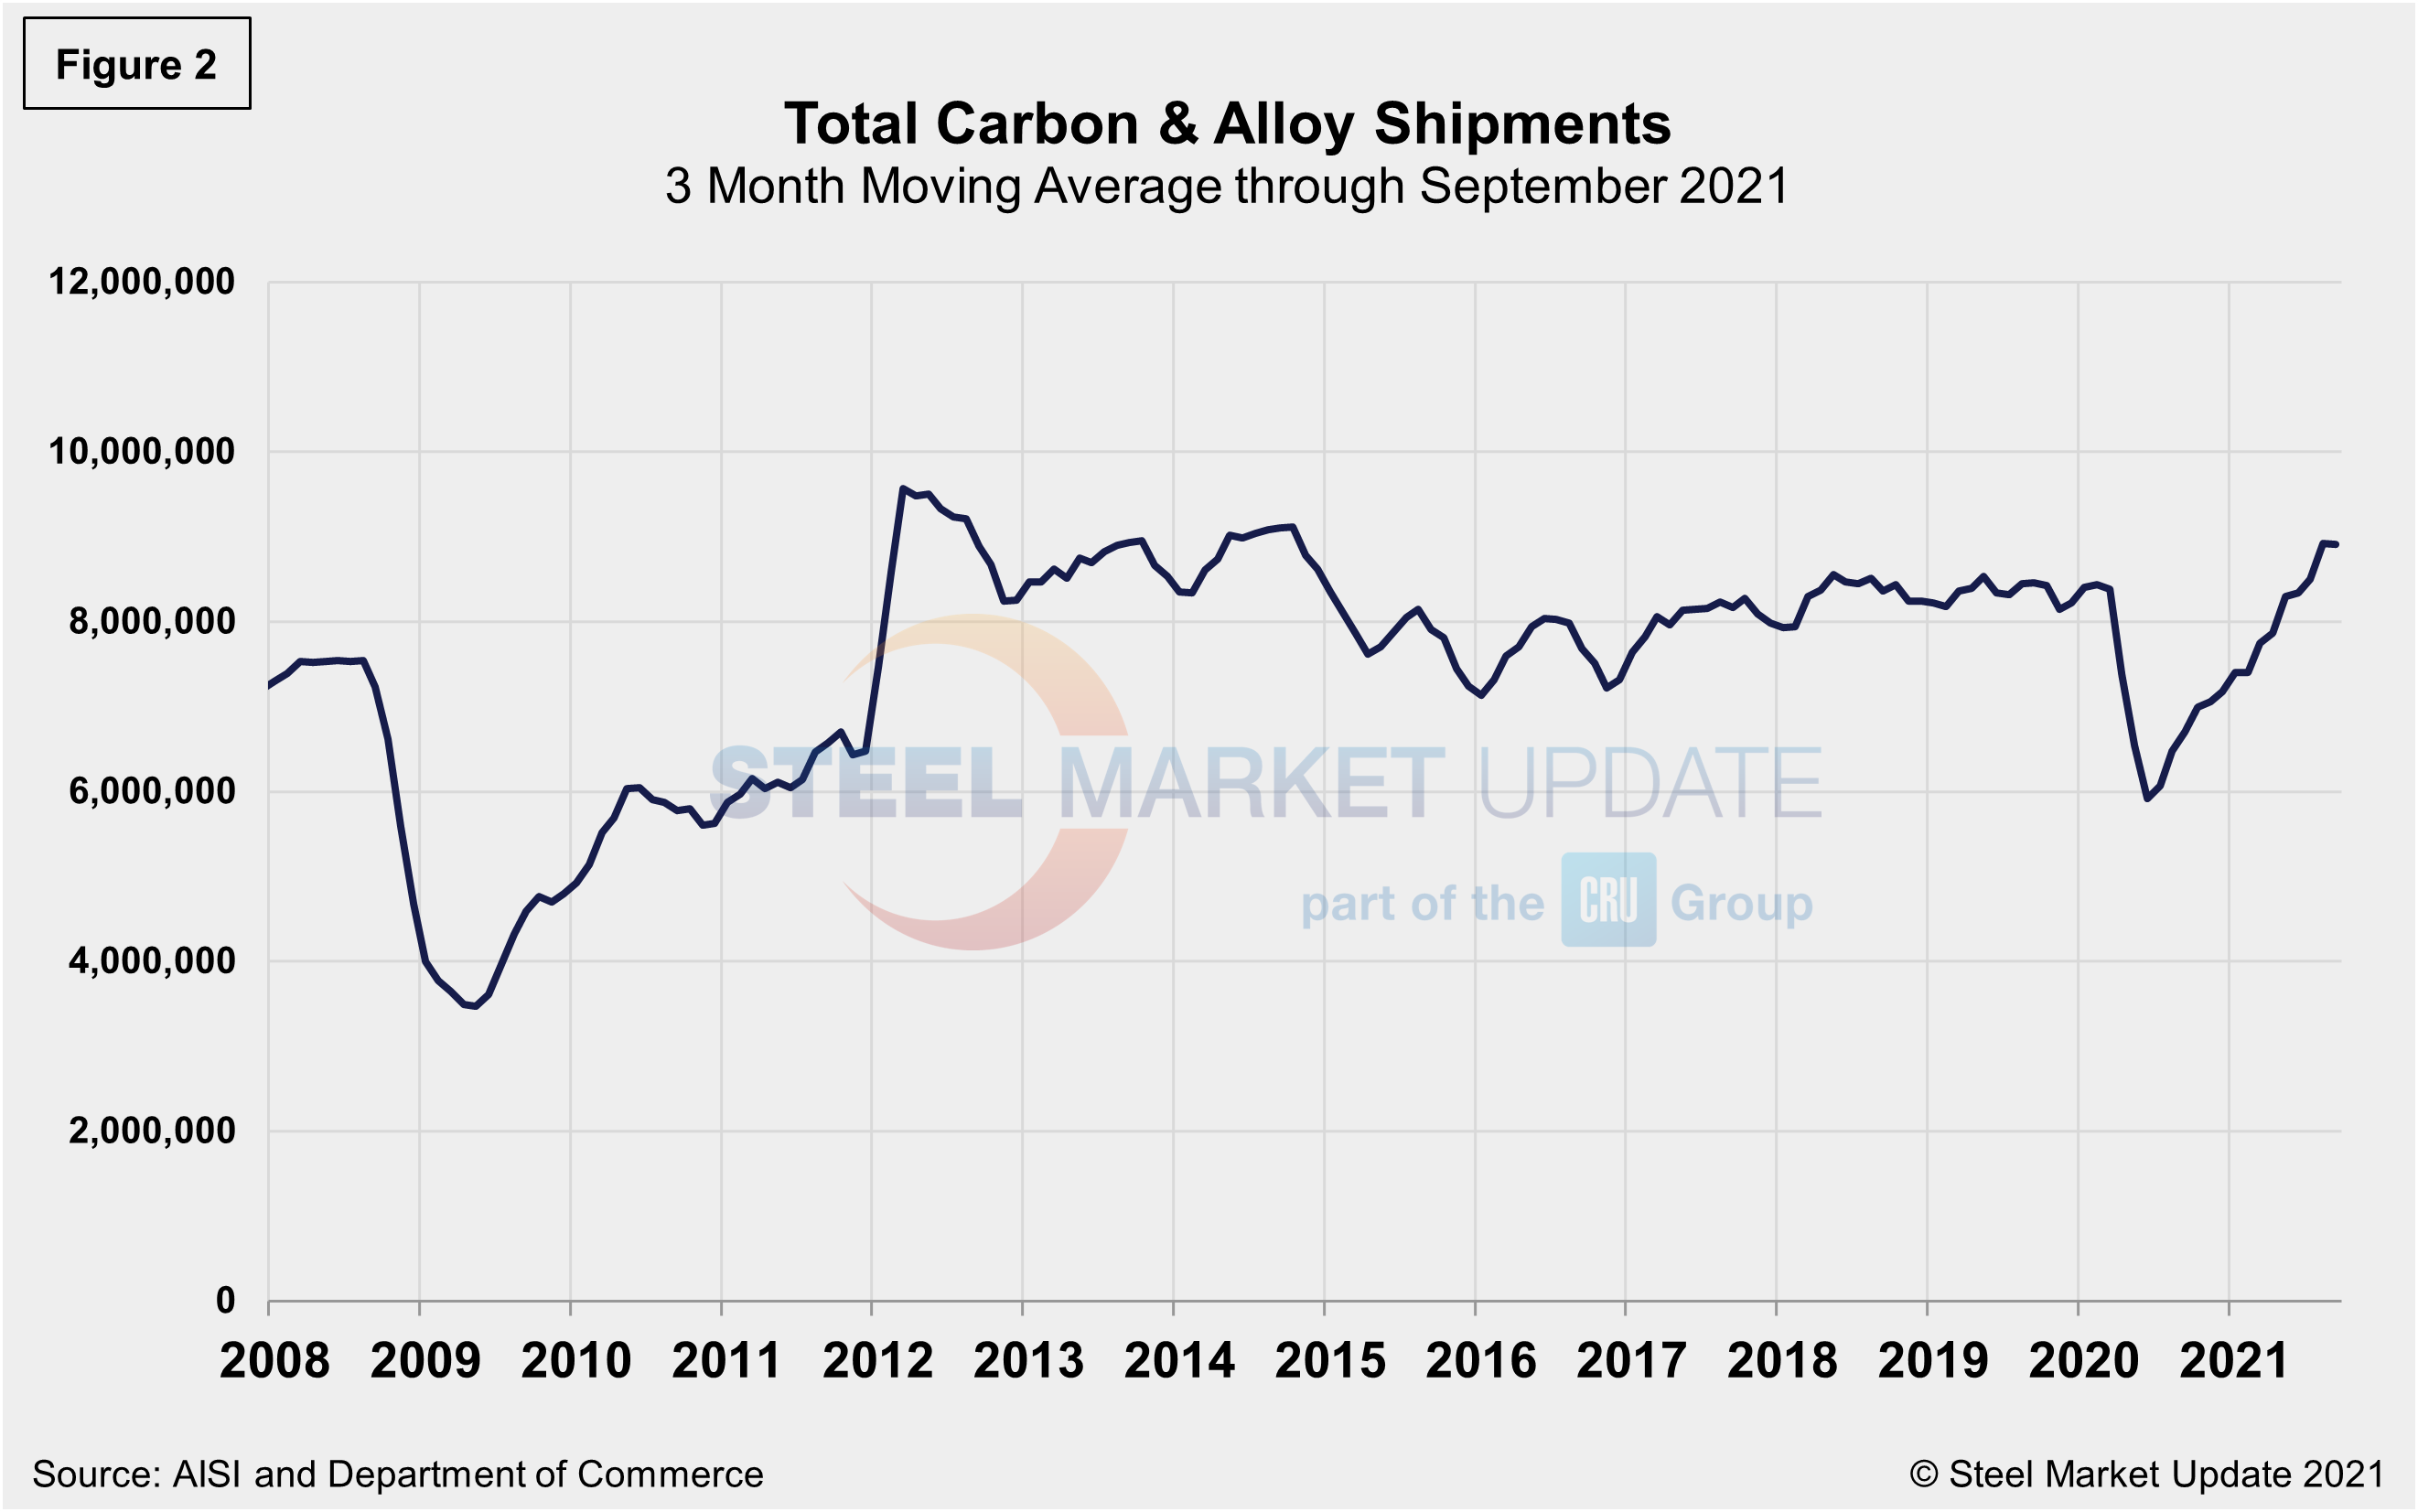
Monthly shipment data for all rolled steel products is noted in Figure 2. The trajectories of the rebounds since Q2 2020 are comparable in Figures 1 and 2. Measured as a three-month moving average (3MMA) of the monthly data, September’s total was 8.909 million tons, compared to 8.925 million tons in August, a decrease of 0.2%. Shipments were up 32.8% in September compared to the year prior when shipments were 6.708 million tons. The recovery from the COVID-related shutdowns has been meaningful. Current shipments are up 5.3% from the same pre-pandemic period in 2019.
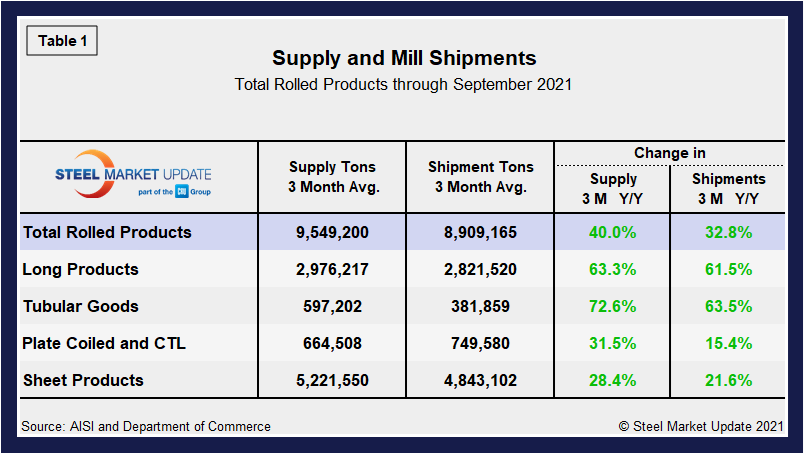
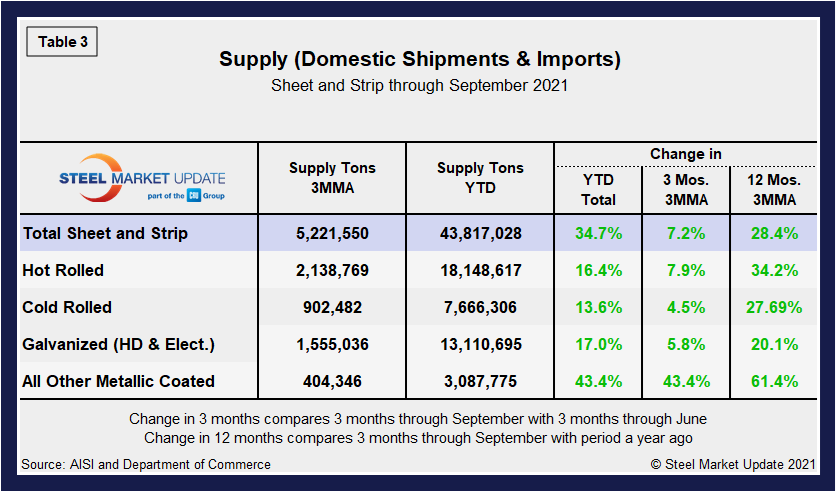
Shipment and supply details for all product groups are noted in Table 1, followed by individual sheet products in Table 2, and domestic supply (shipments and imports) in Table 3. Total supply (proxy for market demand) as a 3MMA was up 40.0% year over year in September, a big turnaround from the 23.9% decline last September as the market was trying to rebound from the pandemic-driven doldrums. Apparent supply is defined as domestic mill shipments to domestic locations plus imports. Mill shipments were up 32.8% in September, also a complete reversal from a decrease of 20.7% seen during the same year-ago period in the same 3MMA comparison. The recovery has varied significantly among various products, but should continue to trend up due to steady domestic output, but especially as foreign material continues to make its way onto U.S. shores.
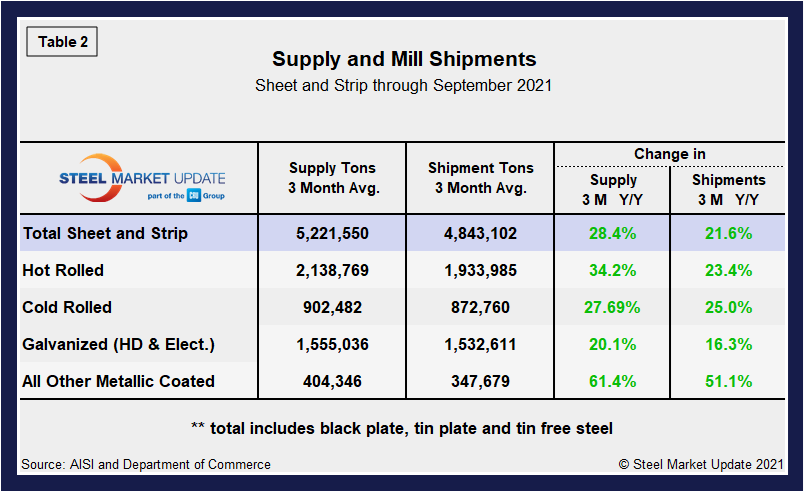
Overall sheet product shipments and supply (Table 2) have improved markedly month on month. Sheet supply increased by 28.4% and shipments by 21.6% in September, a strong recovery from declines of 15.3% and 15.0% seen one year ago. In the three months through September 2021, the average monthly supply of sheet and strip was 5.222 million tons, up from 5.152 million tons or 1.4% above the prior month. Total sheet and strip apparent supply is up 34.7% year to date (Table 3) compared to 2020. Note that year-over-year comparisons have seasonality removed.
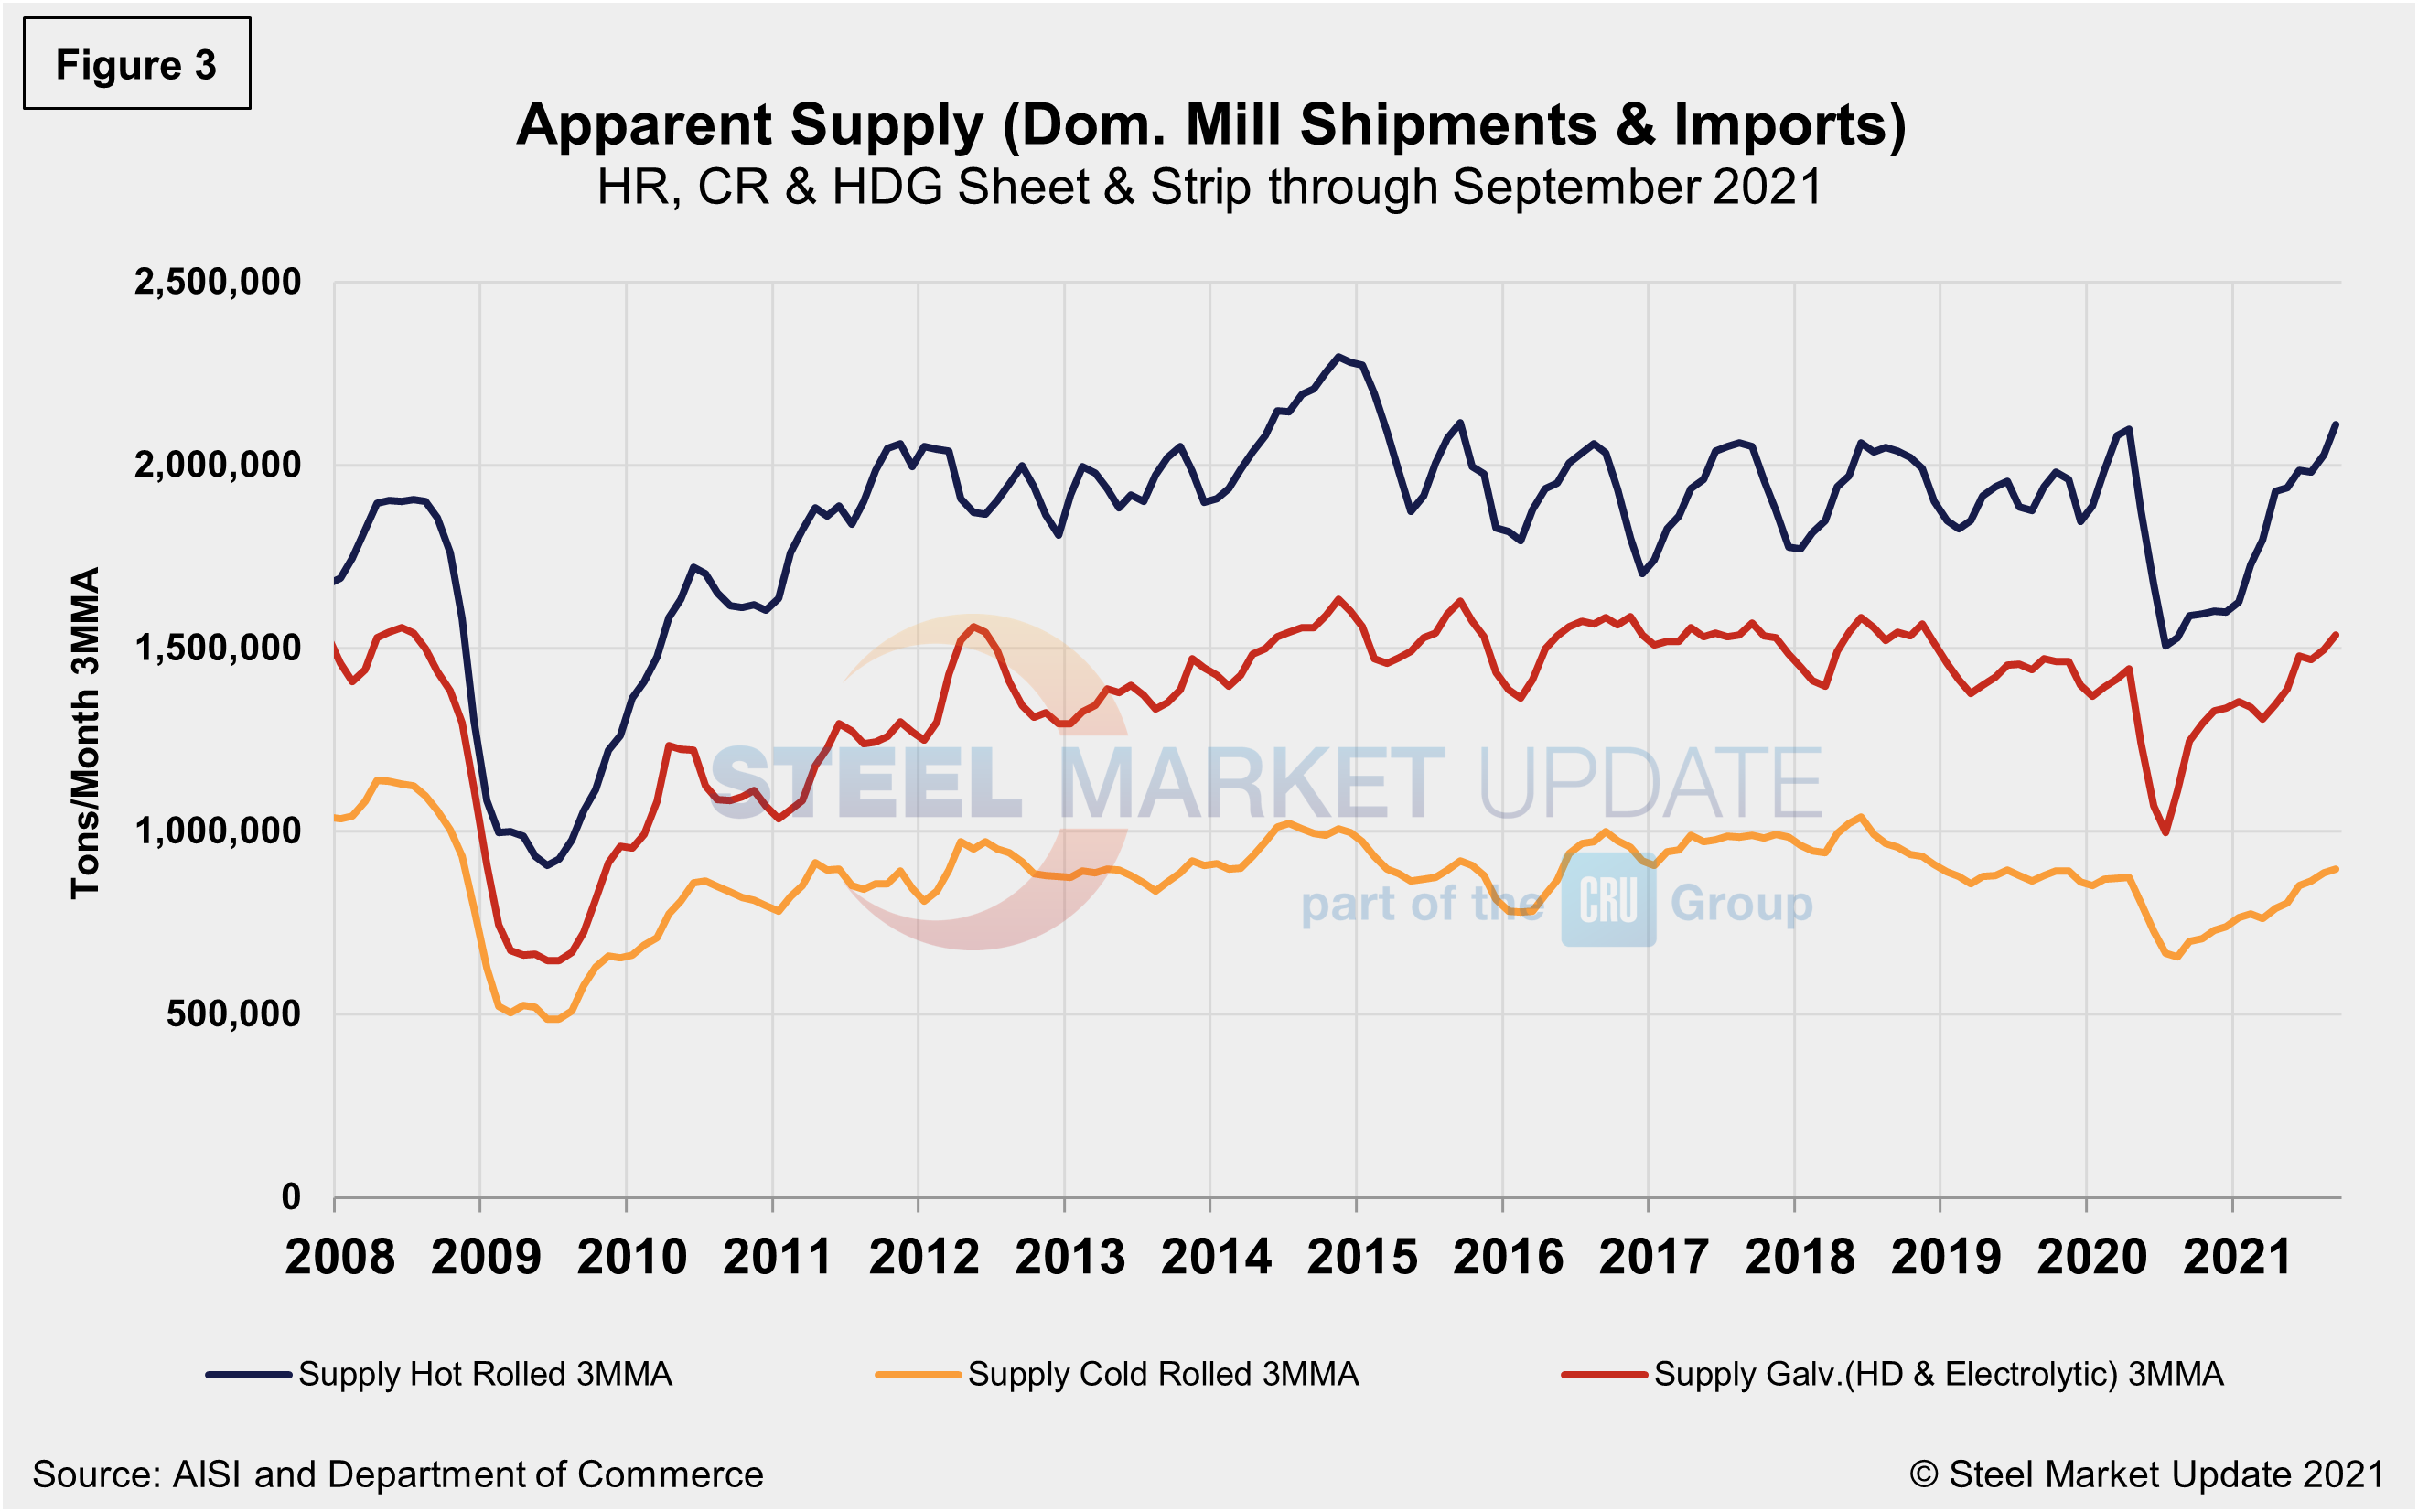
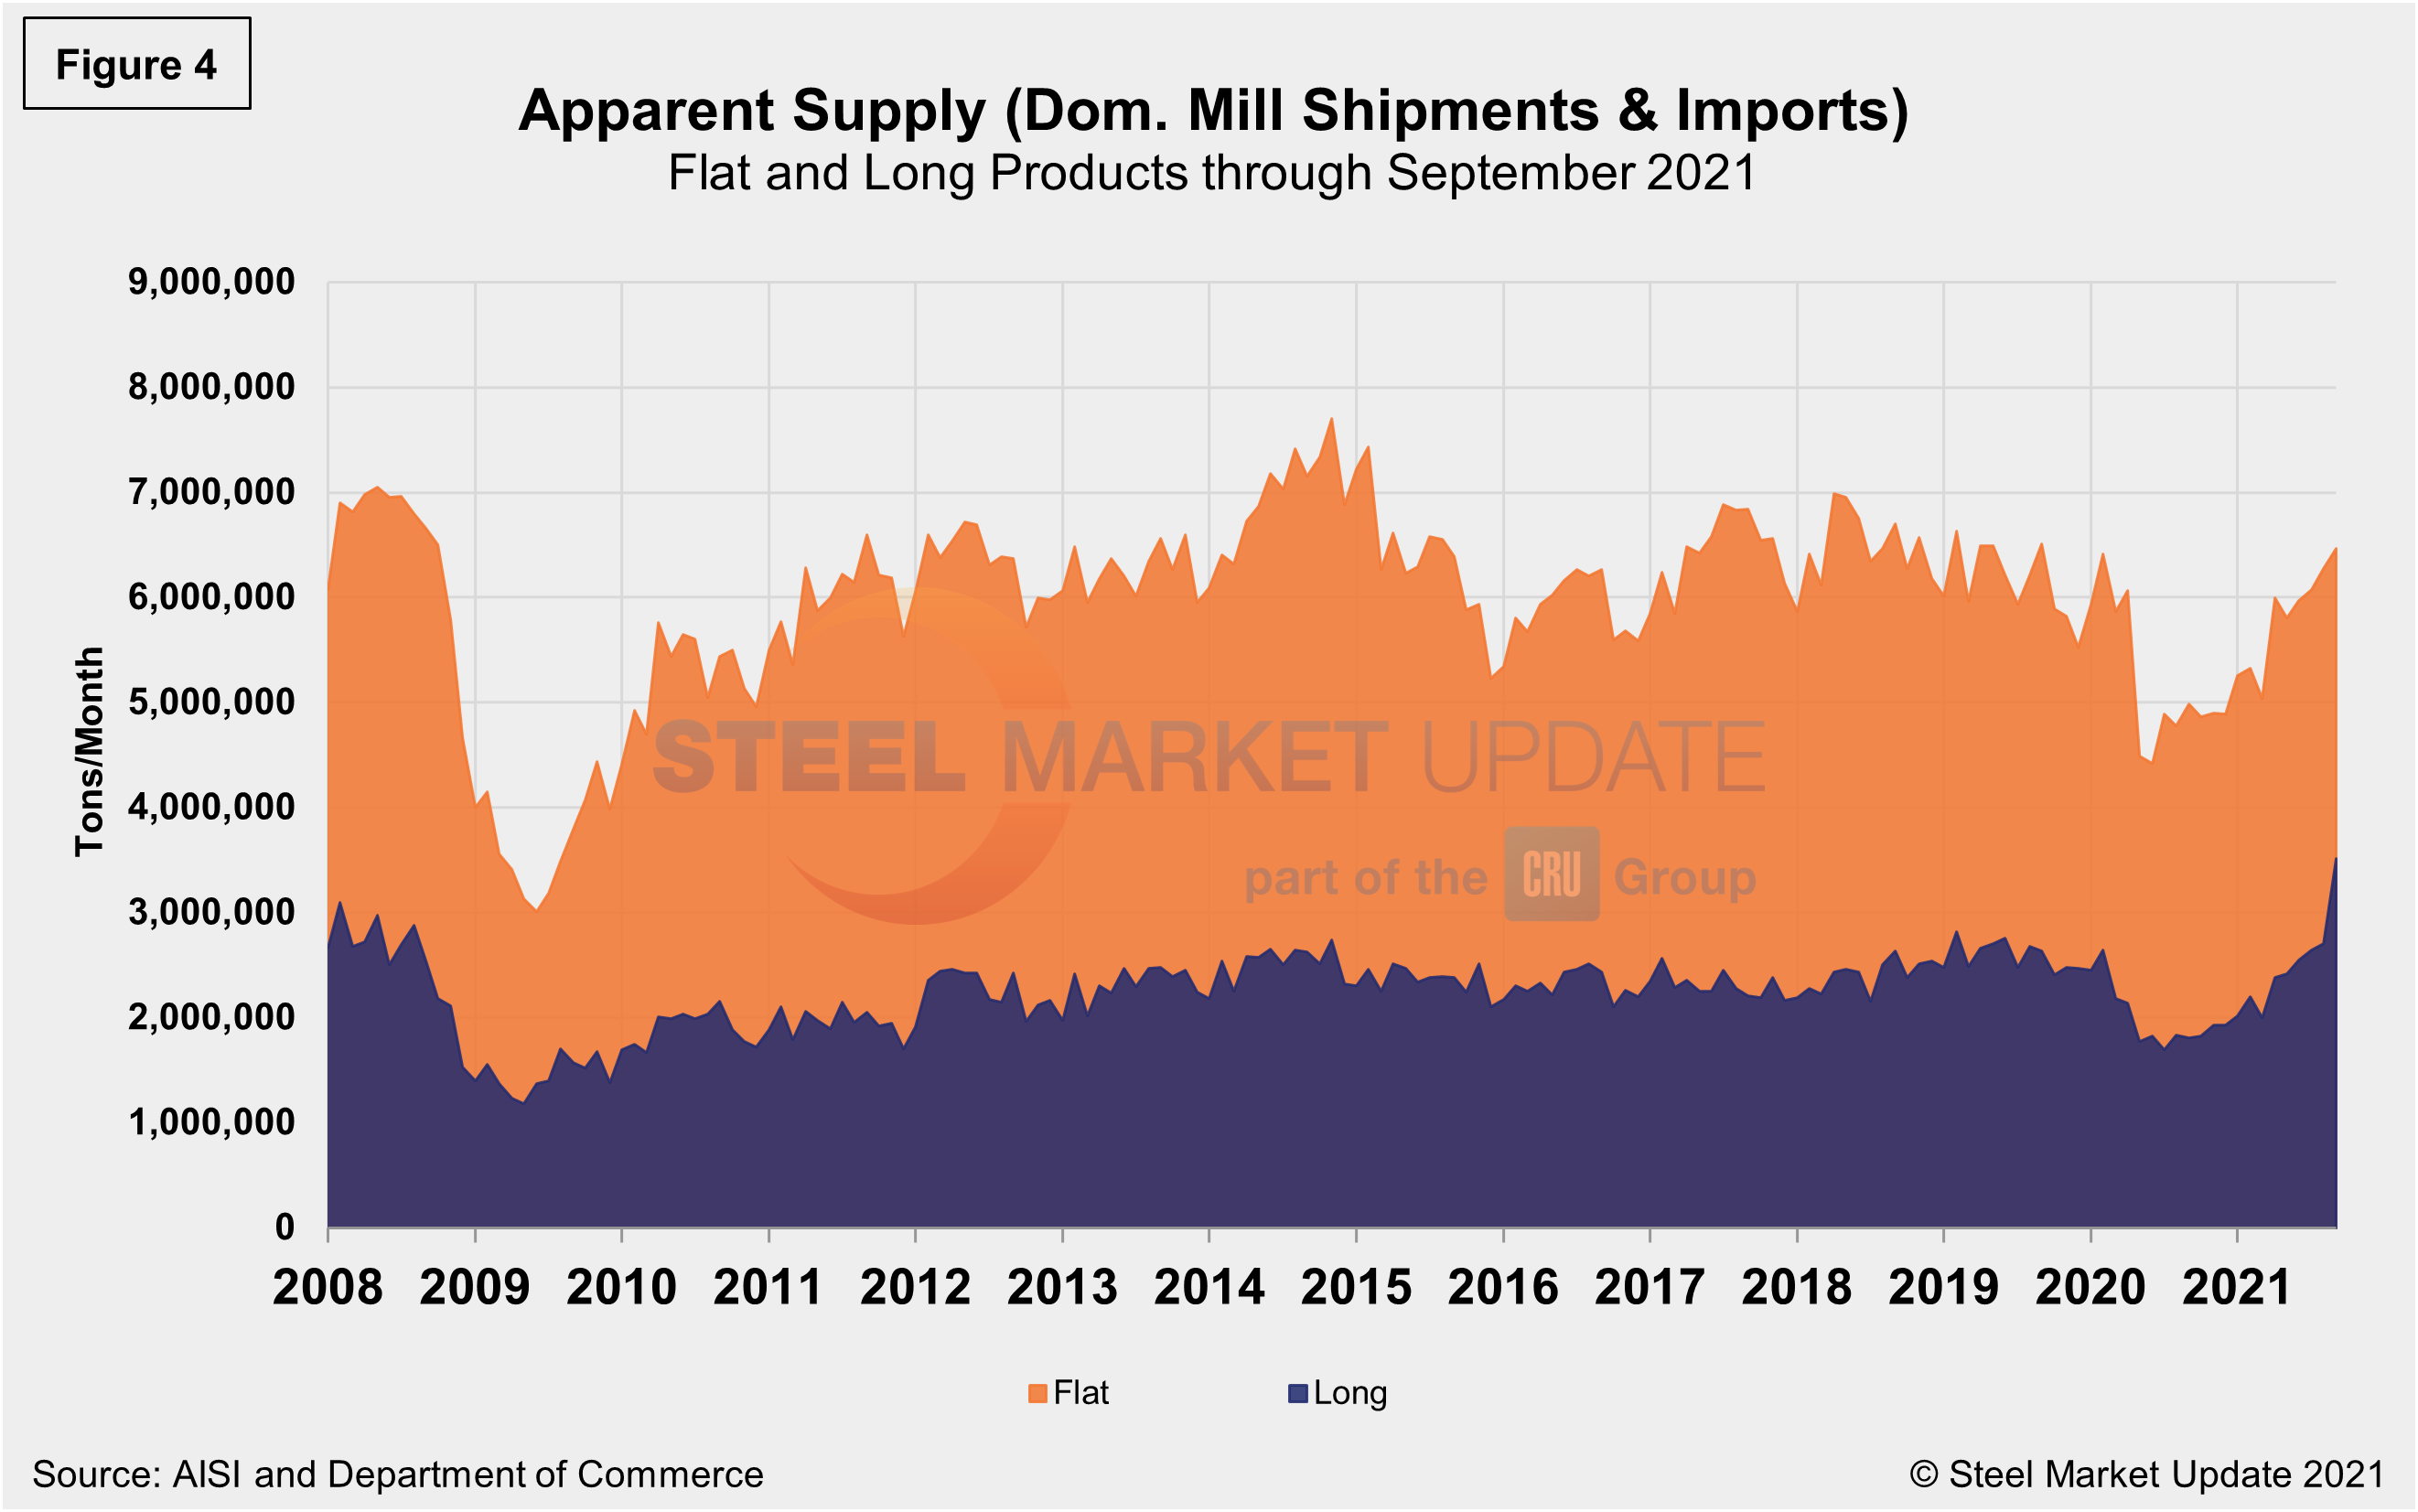
The supply picture for HRC, CRC and HDG since August 2008 as three-month moving averages in Figure 3 and Figure 4 shows the long-term comparison between flat and long products. All three sheet products have experienced some improvement since mid-2020, but galvanized (hot dipped and electrolytic) has seen the strongest rebound, a 56.0% jump since reaching bottom in June 2020, and up 1.2% month on month in September. When compared to the same pre-pandemic period in 2019, the supplies of all three products are presently higher; hot rolled coil at an 8.0% increase is the highest, followed by galvanized (hot dipped and electrolytic) at 6.2% higher, while cold rolled is just 1.1% above the same pre-pandemic period in 2019. In Figure 4, note that these are monthly numbers (not 3MMAs), which show the trend difference between longs and flat products including plate.
By David Schollaert, David@SteelMarketUpdate.com


