Prices

July 29, 2021
HRC Futures Continue Higher as Open Interest Declines
Written by David Feldstein
Editor’s note: SMU Contributor David Feldstein is president of Rock Trading Advisors. David has over 20 years of trading experience in financial markets and has been active in the ferrous futures space for over eight years. You can learn more at www.thefeldstein.com or add him on twitter @TheFeldstein and on Instragram at #thefeldstein.
Following Memorial Day, the CME HRC futures curve exploded gaining over $300/st for the months of September through February while almost every other month gained at least $200. There was a furious push into the last day of the quarter with July, August and September futures settling above $1,800. This buying looked to be primarily attributed to OEMs locking in forward prices.
CME Hot Rolled Coil Futures Curve $/st
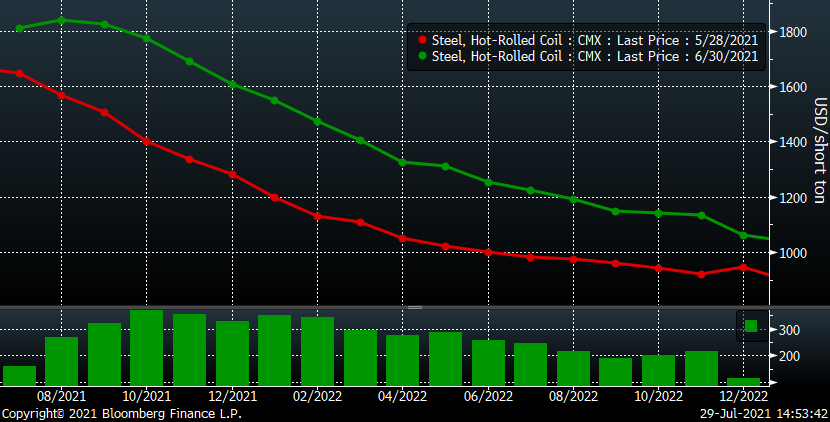
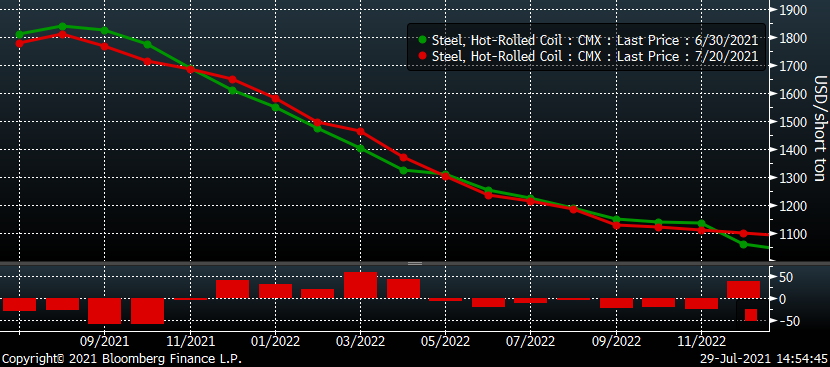
However, once the third quarter started, the aggressive buying fizzled out with the curve mixed. The front end drifted lower while the December through April percolated slightly higher. The market got quiet, and the hyper-volatility of June vanished.
CME Hot Rolled Coil Futures Curve $/st
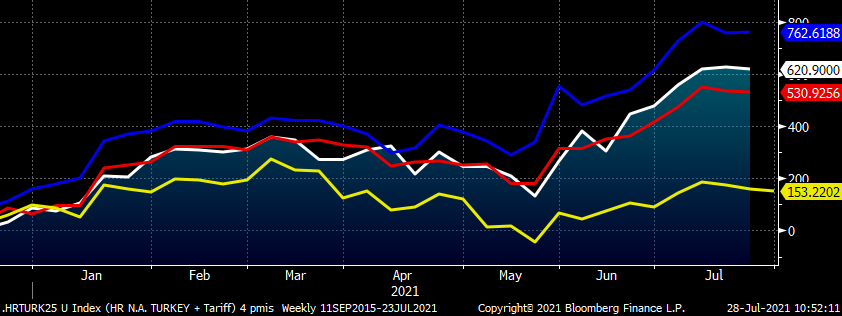
The sharp price increases in both the physical and futures markets sent the Midwest premium to global tariff-adjusted hot rolled from the already inflated $200-400 range to the $500-750 range.
232 Tariff Adjusted Hot Rolled Spreads – Turkey (wh), Vietnam (bl), Japan (red) & N. Europe (yel)
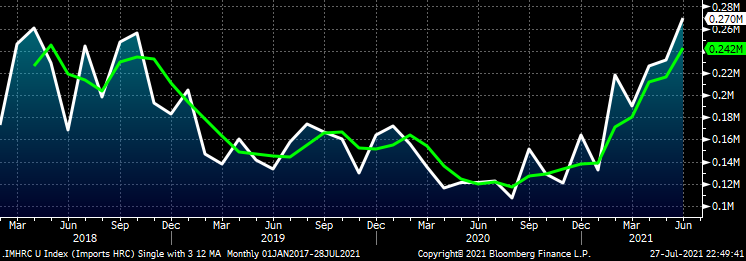
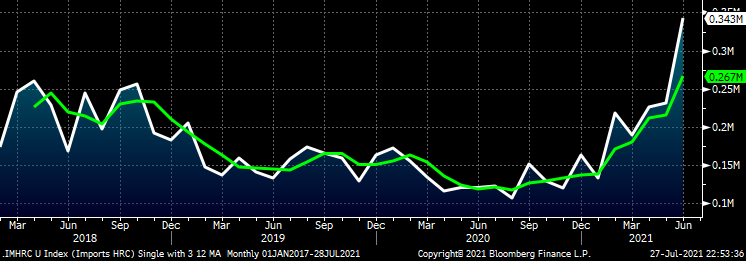
License data for June hot rolled imports indicated a solid MoM increase to 270k short tons.
Imports – Hot Rolled Sheets – License Data
Then on July 25, the DOC updated its site with preliminary Census data for June’s hot rolled imports adding another 73k tons for a total of 343k.
Imports – Hot Rolled Sheets – Preliminary Census Data
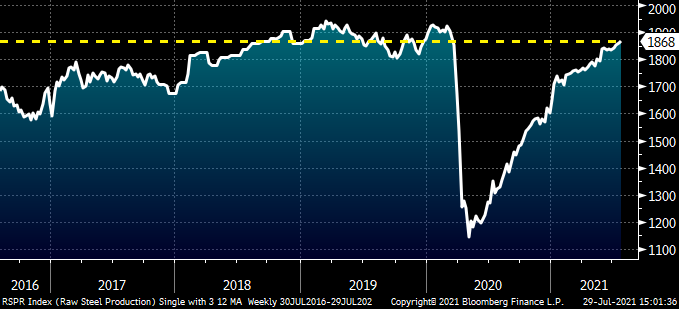
During the month of July, it was learned that service centers added over 200k tons to their inventory, an inventory gain for the second straight month. AISI Weekly Crude Steel Production has continued to steadily increase with last week’s production of 1.868 million short tons just below the highs for the third week set in July 2019 and the most since the start of the pandemic.
AISI Weekly Raw Crude Steel Production
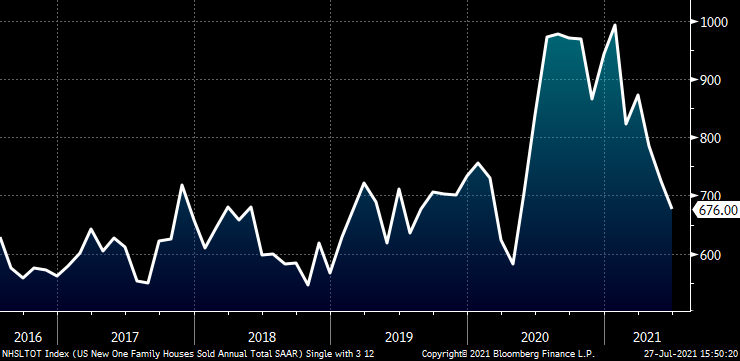
Meanwhile, June’s SAAR for new-home sales fell sharply, even below June 2019 levels, and badly missed expectations of a 796k SAAR.
U.S. New-Home Sales SAAR
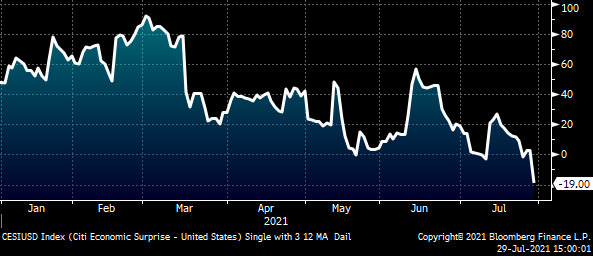
Today, the preliminary estimate for second-quarter U.S. GDP was an annualized increase of 6.5%, but that missed expectations of an 8.4% annualized growth rate. The chart below of the Citi U.S. Economic Surprise Index measures actual economic data relative to economists’ expectations. The chart has been in a steady downtrend reflecting numerous misses in data points such as nonfarm payrolls, auto sales, new-home sales, industrial production, etc.
Citi U.S. Economic Surprise Index
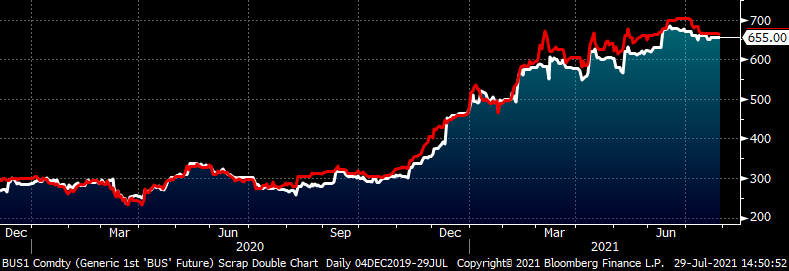
After trading above $700/lt to start the quarter, CME busheling futures have drifted lower with the August future settling today at $655/lt. This while daily hot-rolled indices have moved swiftly in the other direction gaining roughly $150/st.
Rolling Front (white) & 2nd (red) Month CME Busheling Future $/lt
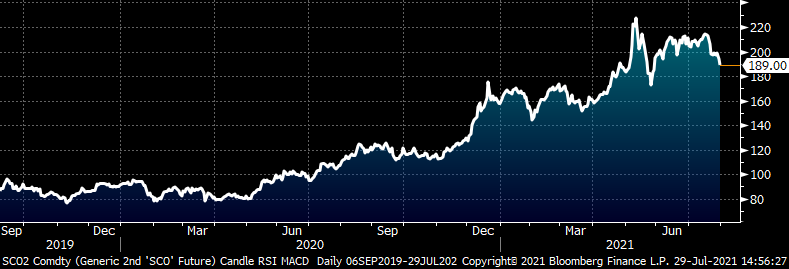
Iron ore has fallen just over $23/t from $212.79 on July 20 to $189 today.
Rolling 2nd Month SGX Iron Ore Future $/mt
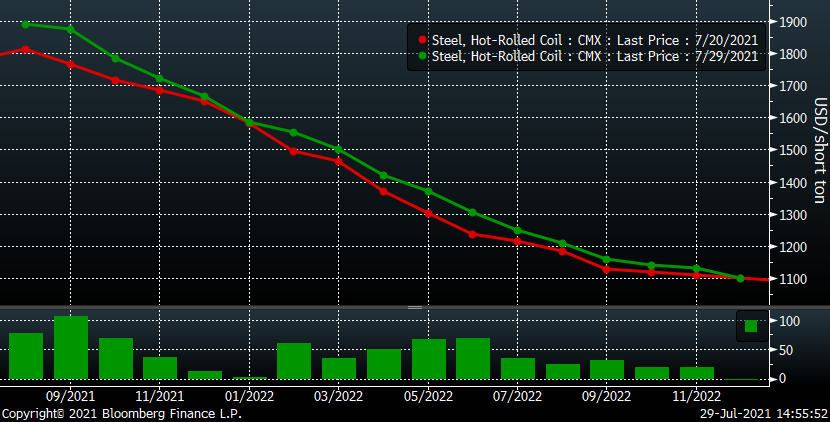
If you consider all of this downbeat information just provided, then it will be no surprise when I tell you that since July 20, CME hot rolled futures have rallied another $50-100/t as far out as June 2022 as what looks to be the reemergence of OEM forward buying. Huh?
CME Hot Rolled Coil Futures Curve $/st
In the chart below, the white line is the rolling 2nd month CME HR future, the red line is the daily aggregate open interest across all CME HR futures months and the yellow line is a 22-day moving average of this. One of the most basic technical indicators relates to open interest. If open interest is growing while prices are increasing, it is considered a strong bull market. The idea is the strength is from buyers opening new futures positions, and the same is true of a technically strong bear market where declining prices are accompanied with growing open interest by new short positions being opened.
Rolling 2nd Month CME HRC Future $/st (wh) & Aggregated Open Interest
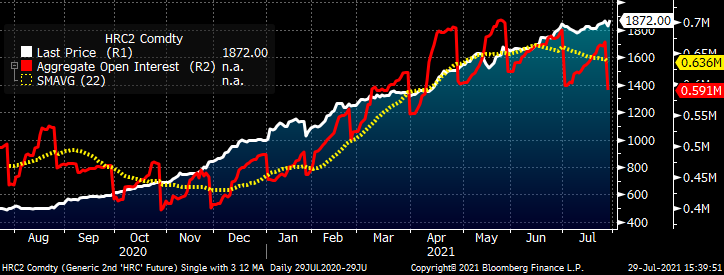
A technically weak bull market is one where prices are rising, but open interest is declining (again, the same is true for a bear market). Aggregate open interest across all CME HR futures months looks to have peaked in mid-June, declining ever since. This one data point tells us that the HR futures bull market has shifted from a technically strong one to a technically weak one.
This is one data point, but taken together with the multiple data points above, especially peaking production and imports, begs the question of whether these forward purchases for 2022 will be winners or losers. It also begs the question of whether this record-setting bull market, both in terms of price and duration, will continue into 2022 or if its days are numbered.
Disclaimer: The content of this article is for informational purposes only. The views in this article do not represent financial services or advice. Any opinion expressed by Feldstein should not be treated as a specific inducement to make a particular investment or follow a particular strategy, but only as an expression of his opinion. Views and forecasts expressed are as of date indicated, are subject to change without notice, may not come to be and do not represent a recommendation or offer of any particular security, strategy or investment. Strategies mentioned may not be suitable for you. You must make an independent decision regarding investments or strategies mentioned in this article. It is recommended you consider your own particular circumstances and seek the advice from a financial professional before taking action in financial markets.


