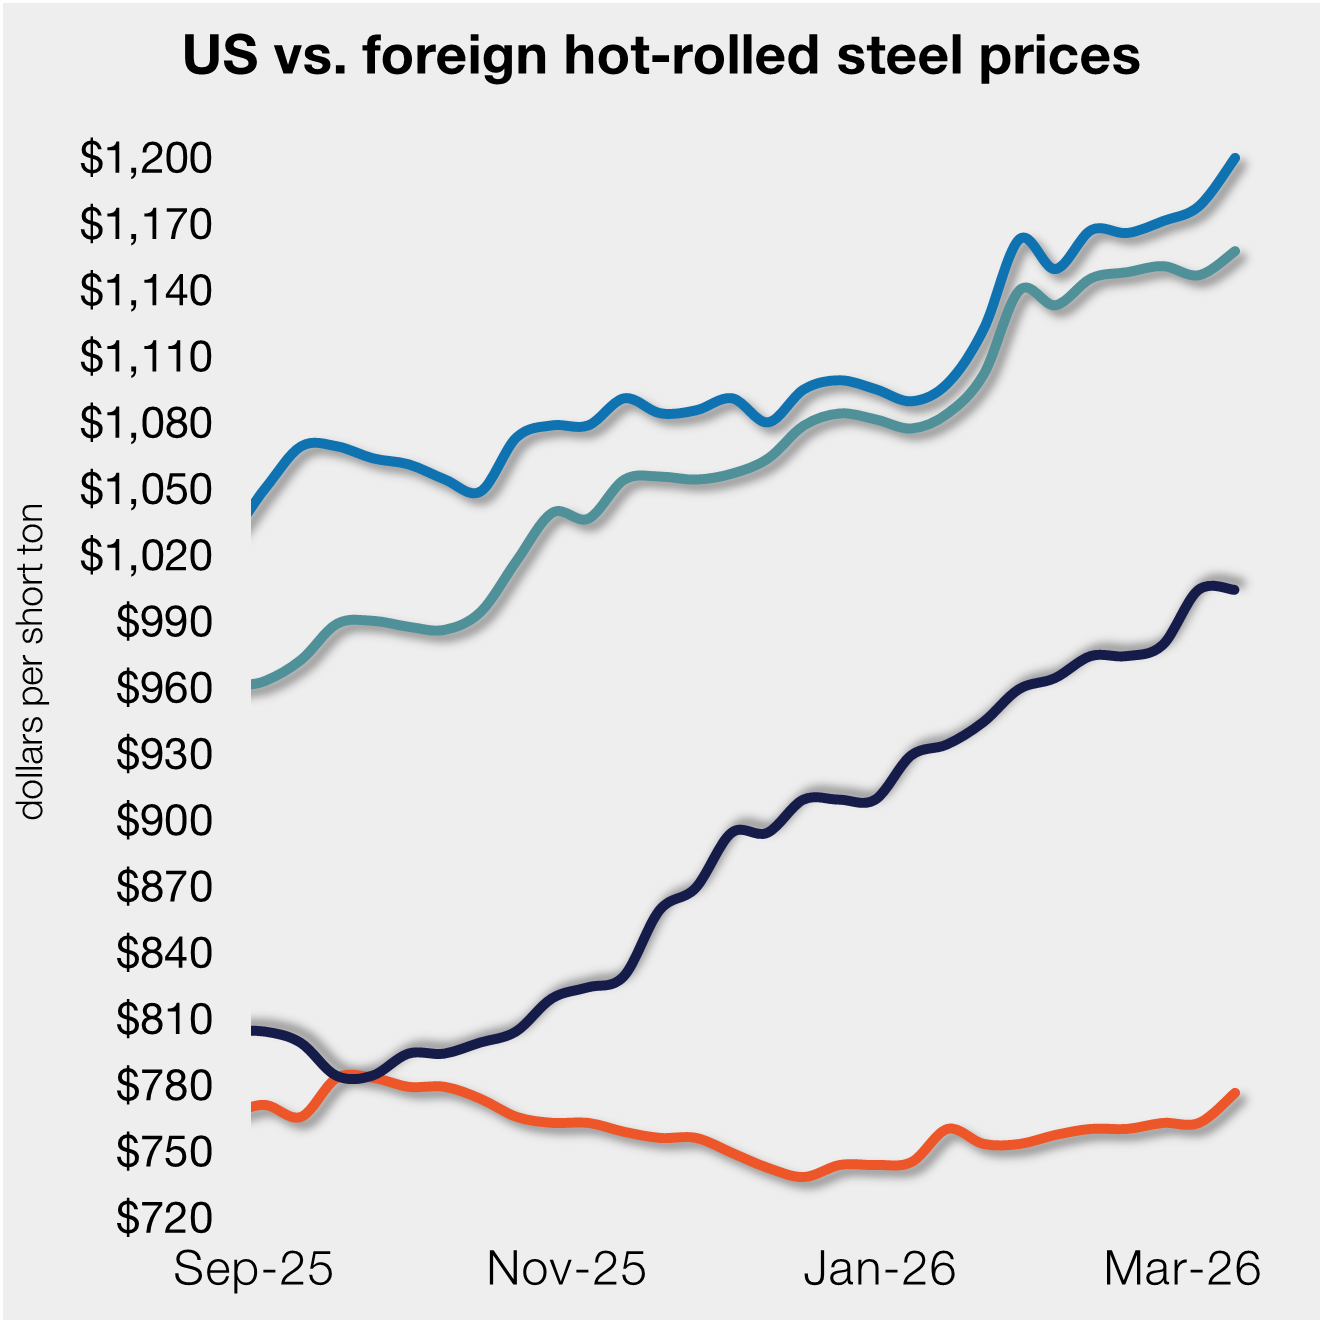

Prices

July 15, 2021
May Apparent Steel Supply Surpasses 9 Million Tons, at a 16-Month High
Written by Brett Linton
May apparent steel supply rose 340,000 tons over April to 9.11 million net tons, according to the latest U.S. Department of Commerce and American Iron and Steel Institute data. This is now the highest suppy level seen since January 2020, surpassing the March 2021 recent high of 8.96 million tons. May supply is up by 2.51 million tons compared to the same month in 2020 (recall that April and May of 2020 were the two lowest levels seen in the last 10 years).
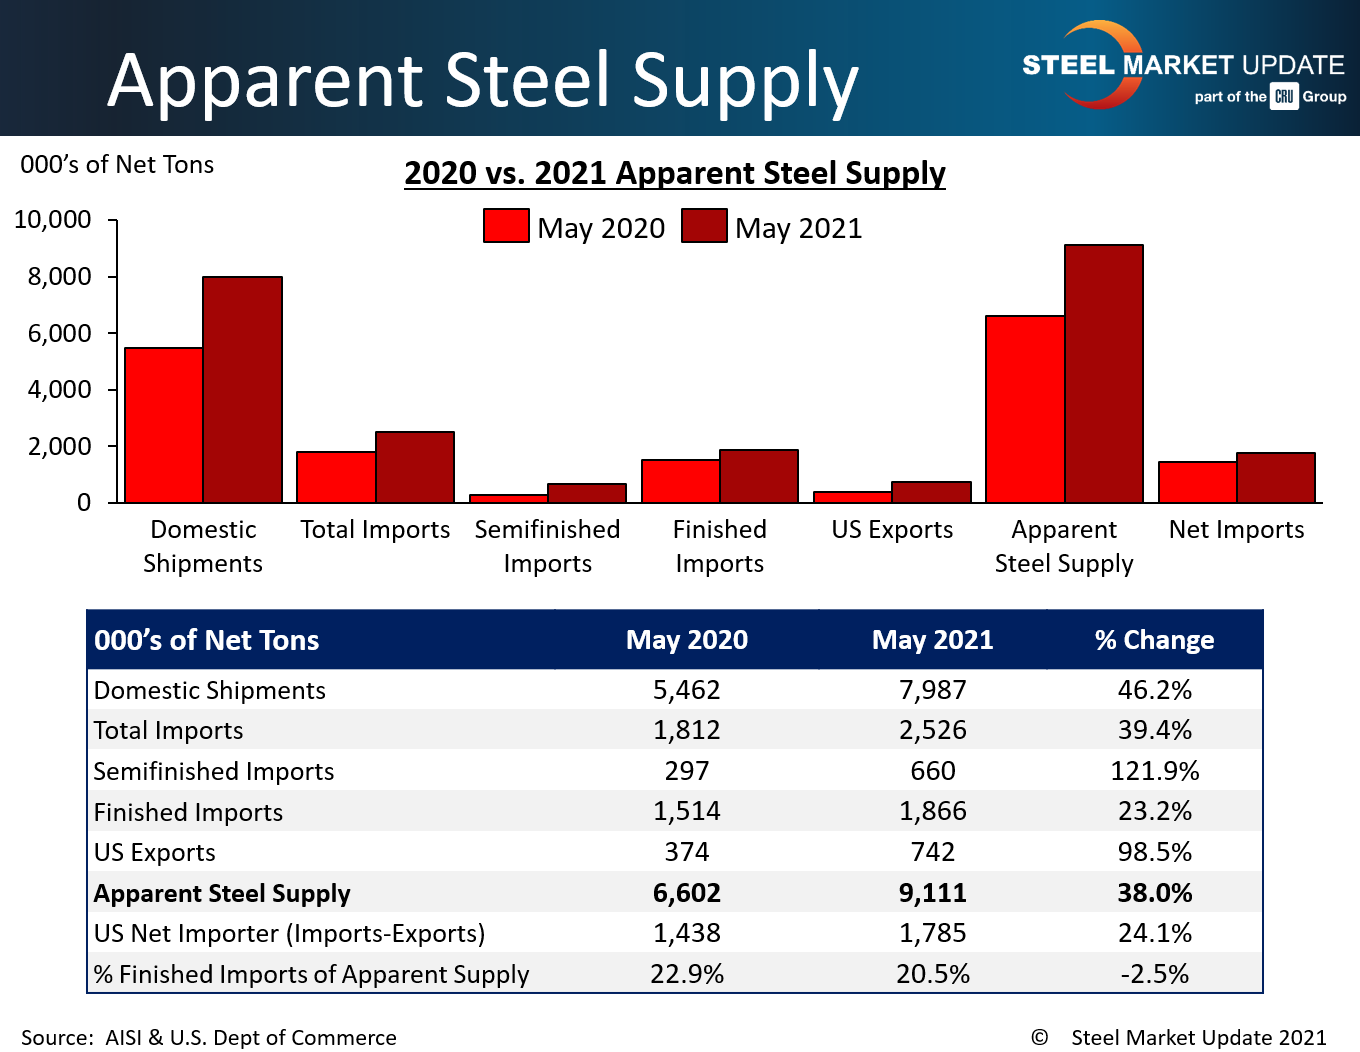
Apparent steel supply, a proxy for demand, is determined by combining domestic steel mill shipments and finished U.S. steel imports, then deducting total U.S. steel exports.
May apparent supply rose by 38.0% or 2.51 million tons compared to the same month one year ago, when supply was 6.60 million tons. This increase was primarily due to an increase in domestic shipments of 2.53 million tons, followed by a 352,000-ton increase in finished imports, slightly negated by a 368,000-ton increase in exports. The net trade balance between U.S. steel imports and exports rose to a surplus of 1.78 million tons imported in May, up 24.1% from one year prior. Finished steel imports accounted for 20.5% of apparent steel supply in May, up from 22.9% one year ago.
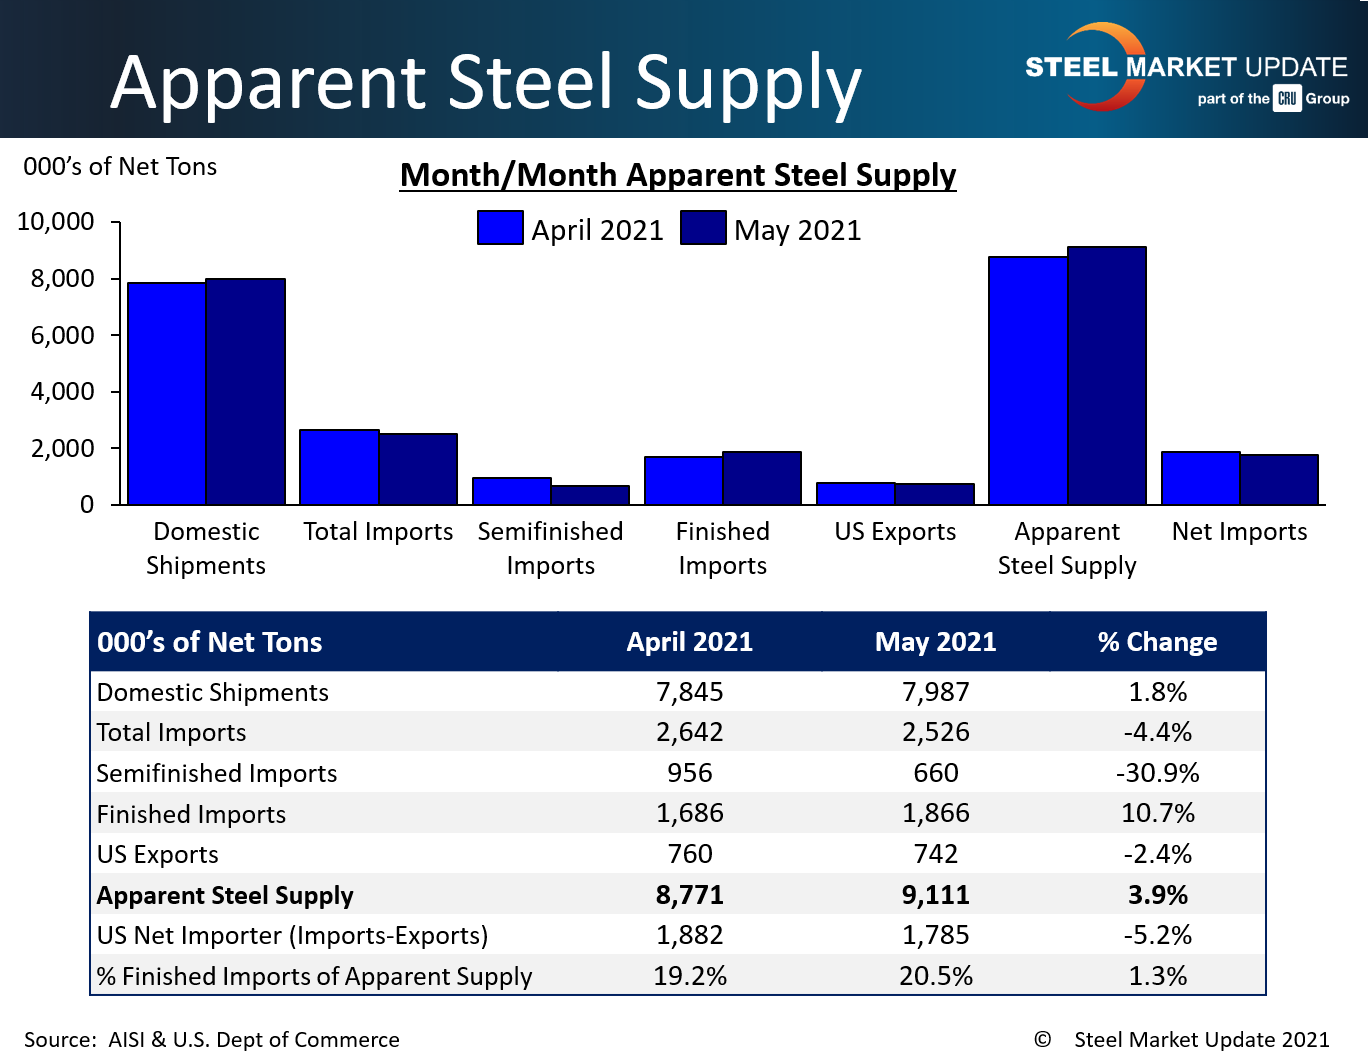
Compared to April when apparent supply was 8.77 million tons, May supply rose by 340,000 tons or 3.9%. This increase was due to a 180,000-ton increase in finished imports and a 142,000-ton increase in domestic shipments, as well as a 19,000-ton decrease in exports. The net trade balance between imports and exports in May fell 5.2% from April, while the percentage of apparent steel supply composed of finished steel imports increased 1.3% month-over-month.
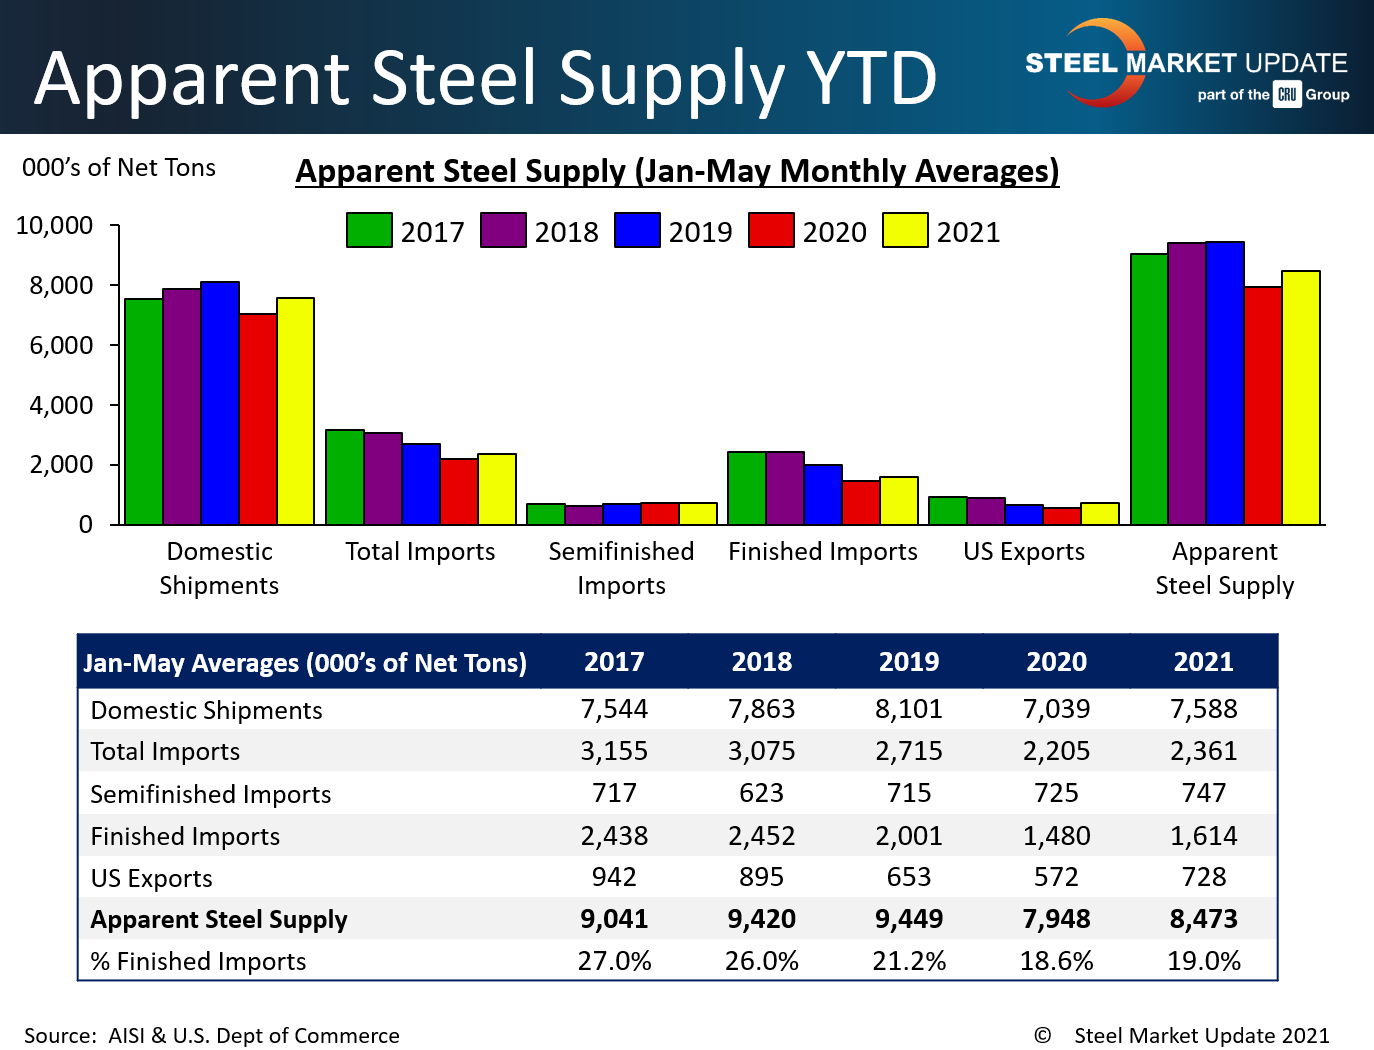
The figure below shows year-to-date averages for each statistic over the last five years. The 2021 apparent supply average has now surpassed the 2020 averages, but remains significantly lower compared to the monthly averages of all previous years shown.
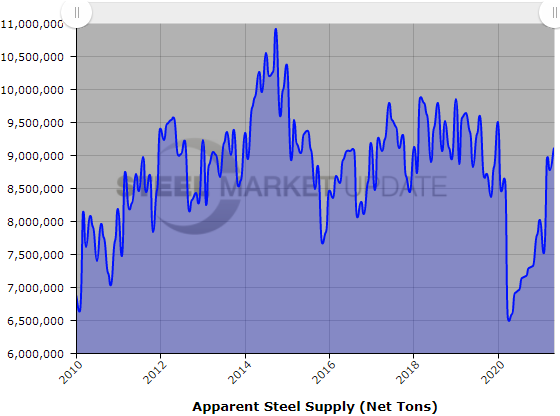
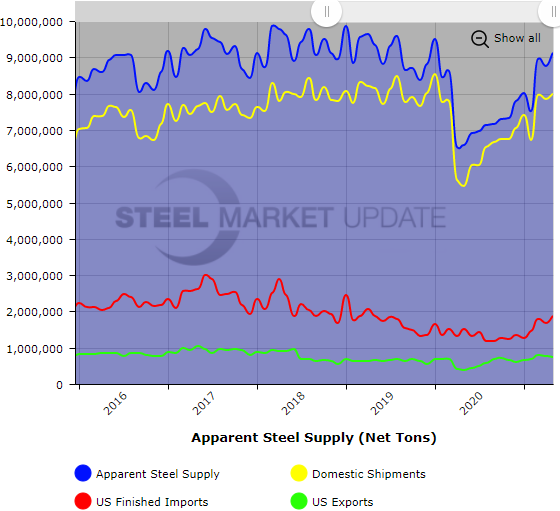
To see an interactive graphic of our Apparent Steel Supply history (example shown below), visit the Apparent Steel Supply page in the Analysis section of the SMU website. If you need any assistance logging into or navigating the website, contact us at info@SteelMarketUpdate.com.
By Brett Linton, Brett@SteelMarketUpdate.com