

CRU

December 17, 2020
CRU: How Will the Commodity Industry Remember 2020?
Written by Jumana Saleheen
Steel Market Update is pleased to share the following Premium content with Executive members. For information on how to upgrade to a Premium-level subscription, email Info@SteelMarketUpdate.com.
By CRU Principal Economist Alex Tuckett and Chief Economist Jumana Saleheen, from CRU’s Global Economic Outlook
As the curtain falls on 2020, this overview looks back on the year and picks out five features for which it will be remembered. Covid-19 and its impact on our industry is foremost. Moves in commodity price and currencies have been significant too, giving rise to winners and losers in the industry. The U.S. election was closely watched given the importance of the U.S. economy and its policy on global growth and trade.
Calling the Shape of the Covid-19 Crisis
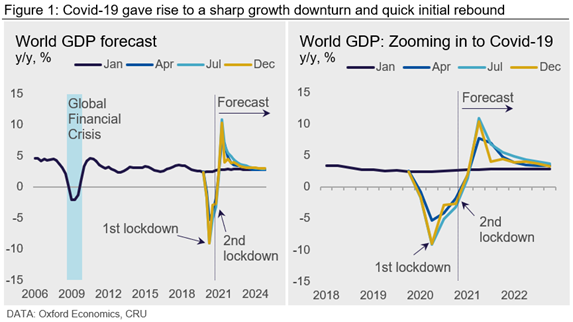
During the first half of 2020 there was heated debate on the shape of the downturn that would follow from Covid-19. In April, we predicted a U-shaped downturn, defined as a recession where loss of skills and lack of investment would result in a world economy which was permanently smaller relative to pre-Covid expectations.
Figure 1 shows that the Covid-19 downturn has been much deeper than the downturn caused by the Global Financial Crisis, but the recovery has been much quicker. The right-hand section shows a series of forecasts for 2020 and 2021, made by CRU at different points in 2020. Note that forecasts for 2020 were downgraded during the year as new data became available. As the virus continued to spread, further restrictions in Europe during October and November meant that a second dip in activity is expected in the final quarter of this year and the first part of 2021.
• The effectiveness of the public health response: East Asian economies such as China, South Korea and Singapore have been more successful in controlling the virus. This has enabled their economies to make a quicker return to normality.
• The industrial structure of each economy: Countries with a large exposure to the retail, hospitality, entertainment, and travel industries (i.e. sectors hit hardest by social distancing) have experienced a larger loss in output than countries with large industrial sectors, which have remained open during lockdowns. The smaller GDP fall in Germany relative to Spain is partly because the former has more manufacturing industry and the latter more tourism.
• The effectiveness of government stimulus: The U.S. provided a large fiscal stimulus (14% of GDP). However, some have argued that the funds have been wasted, in that they did not feed through to boost economic activity. In contrast, China’s smaller stimulus (6% of GDP) has been effective in boosting its GDP (data suggest the fiscal multiplier has been high). Stimulus has been smaller in emerging markets such as India, which has been constrained by fears about losing financial market access if debts get too high.
China scores well on all three factors and has therefore reaped benefits in the form of a strong rebound in activity. This has been beneficial for metals demand and metal prices.
Macro Factors Drove Commodity Price Moves Through 2020
Commodity prices have had a bumpy ride this year (Figure 2). They began their descent in February when the Covid-19 outbreak was at its height in China. Prices reached a low point in mid-March, by which time the virus had been declared a pandemic by the WHO. They stayed flat at around 15% below January levels until May 2020. Over the summer the outlook for commodity demand and prices started to recover, following the economic rebound in China. The rebound was particularly strong for industrial metals, given the impact of China’s stimulus on traditional (metal-intensive) infrastructure projects. Prices stabilized again in the autumn, before moving up again in November. This recovery was driven by growing confidence in the economic recovery, following positive vaccine developments.
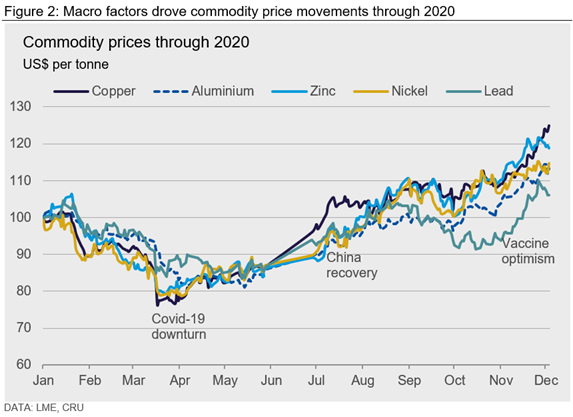
Historically there tends to be a negative correlation between commodity prices and the trade weighted dollar. That relationship held good through 2020. The trough in commodity prices in mid to late March occurred when a flight to safety led the trade weighted dollar to reach a peak. Since then, the trade weighted dollar has followed a broad downward trend, helping commodity prices to move higher.
The Rise and Fall of the Dollar
As uncertainty about the impact of the pandemic reached a crescendo in March, investors fled to the safety of the U.S. dollar (Figure 3). This meant that most currencies depreciated against the dollar between Jan. 2 and March 23, which marked a high point for the U.S. dollar.
The second and third quarters of the year saw more disparate FX movements. Prospects for advanced economies brightened in response to unprecedented policy stimulus and some success in controlling the virus. Investors diversified away from the U.S. dollar, allowing currencies such as the Australian dollar and the euro to gain value against the greenback.
The dollar lost further ground in Q4 against most currencies, as optimism about the availability of a vaccine and economic recovery took hold.
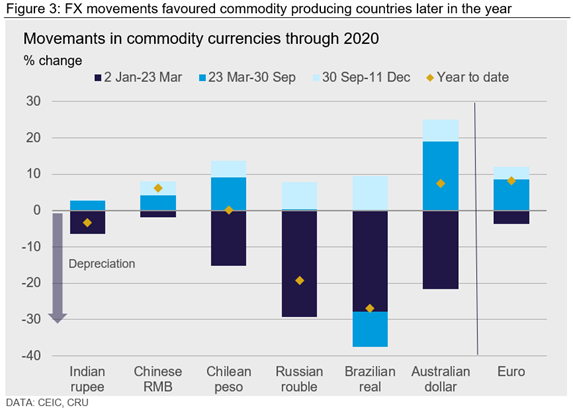
In contrast, poor control of the virus in economies such as Brazil and Russia was one reason why their currencies lost further ground against the dollar through to September.
The Indian rupee and Chinese renminbi (RMB) were more stable through 2020 but for very different reasons. Although the Indian economy has been severely affected by the pandemic, the current account – a source of concern for some time – has gone from deficit to surplus as falling domestic demand reduced imports.
The RMB’s stability is partly a result of it being a managed floating exchange rate. The People’s Bank of China (PBC) intervenes to prevent the currency responding fully to market forces. At the height of the Covid-19 outbreak in China, capital outflows put downward pressure on the RMB. The PBC absorbed part of that through its currency reserves. As the economy recovered, the flow of capital reversed, and the currency has appreciated by 6% since the start of the year.
Oil Price Dips Below Zero
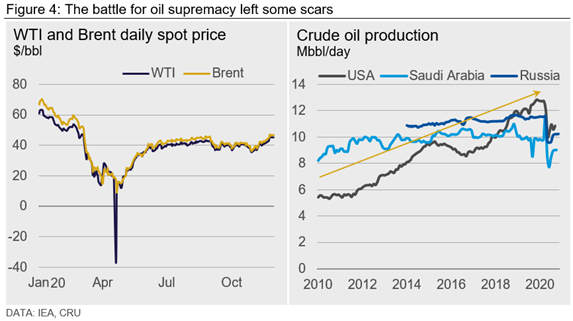
2020 will be remembered as the year in which the West Texas Intermediate (WTI) oil price briefly turned negative, for the first time in history. Our insight in March explained that the negative price was the result of a combination of supply and demand shocks (Figure 4).
• Demand: Oil demand plunged as the first Covid-19 lockdowns resulted in a significant fall in the demand for oil, as industrial activity plummeted, and travel almost came to a standstill.
• Supply: OPEC+ proposed to deal with this negative demand shock with further production cuts, but Russia refused to comply, reportedly to test the fragility of the U.S. shale industry. Russian oil revenues have come under pressure over the past decade, partly a consequence of the rising dominance of U.S. oil production. Saudi Arabia responded by starting a price war with Russia; it flooded the market with supply and significantly cut its official selling price.
• Prices: Inventories rose and buyers and investors rushed to purchase cheap oil futures. This carried on until world oil storage capacity was depleted. Crunch time arrived when sellers were prepared to pay buyers to take delivery of oil. On April 20, the one-month WTI oil futures price turned negative closing at -$37.63/bbl. A few weeks later it showed up in the spot price. Brent crude oil prices also came under similar pressure, but did not turn negative, as Brent oil is a seaborne commodity, and so has greater storage flexibility.
U.S. Election: More Than a Night to Remember
2020 will undoubtedly be remembered for the U.S. election. The policies of the world’s largest economy can have major implications for global growth and trade. For the metals industries, the key factor is the direction of future trade, fiscal and climate policies.
Biden’s pre-election pledge was particularly ambitious with respect to climate and fiscal policies; however, for trade policy, style and tactics are the points of difference relative to President Trump.
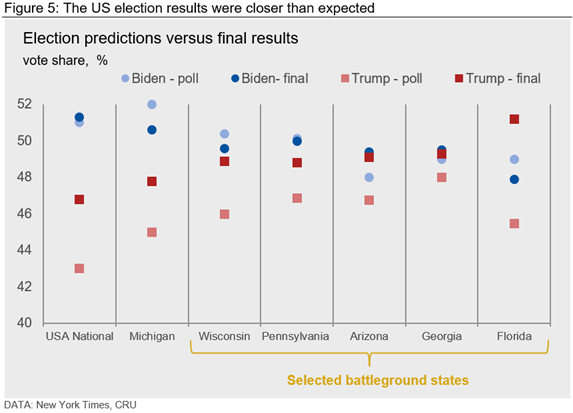
Both parties went into the election in a state of uncertainty. Since the middle of 2019, election polls and forecasting models had pointed to a Biden win. He held a steady lead of 8-10 points in the nationwide vote. However, margins in most battleground states were tighter, and Trump supporters reminded everyone how misleading the polls had been in 2016.
In the event, Biden’s lead in the popular vote was about half of what had been expected, but still substantial, at roughly 4.5 percentage points (Figure 5). More importantly, once the votes had eventually been counted, it became clear that Biden had won narrow victories in several of the key marginal states. This propelled him to an electoral college victory of 306 to 232, a much wider margin than the popular vote (of around 14 percentage points compared to 4.5).
The race for the Senate continues and will be resolved in early January. This will be key to determining Biden’s room for policy maneuvers. That matters greatly for fiscal and other policy issues.
Necessity is the Mother of Invention
2020 was a year like no other. The pandemic challenged how we work, live and vote. It led economic activity to contract faster than ever before in peacetime. Activity rebounded with surprising vigor as economies reopened. These different stages caused sharp movements in many markets, including markets for oil, FX and commodities. The year ends on a high, as a number of vaccines are likely to be available next year. Bring on 2021.
Request more information about this topic.
Learn more about CRU’s services at www.crugroup.com