Prices

December 3, 2020
HRC Futures: HR Higher Despite Increasing Imports, Inventory and Production
Written by David Feldstein
Editor’s note: SMU Contributor David Feldstein is president of Rock Trading Advisors. David has over 20 years of trading experience in financial markets and has been active in the ferrous futures space for over eight years. You can learn more at www.thefeldstein.com or add him on twitter @TheFeldstein and on Instragram at #thefeldstein.
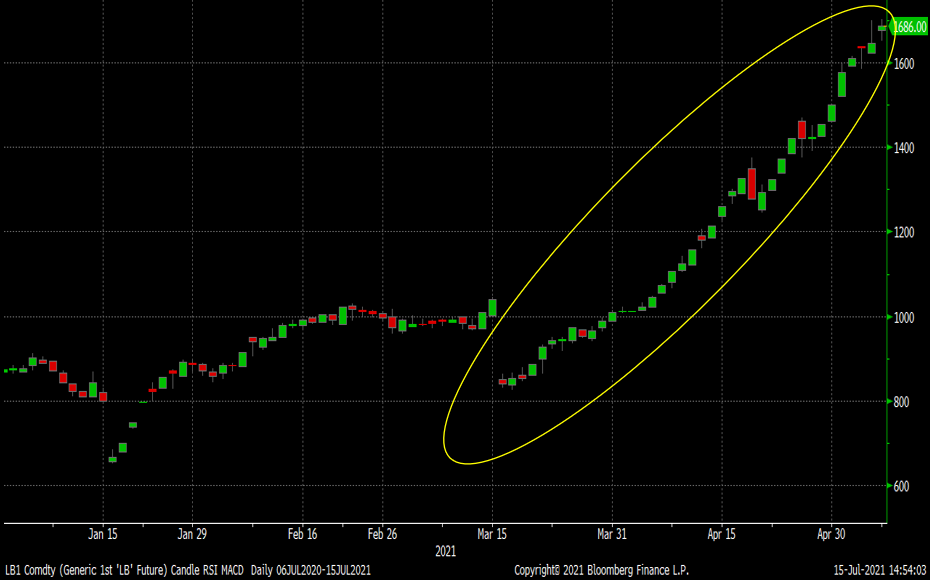
Check out this chart as it goes from $800 at the start of the year to about $1,700 by the end of April. Is that in dollars per metric ton or short ton? Neither, it’s in dollars per board feet because it’s not Midwest hot rolled, it’s lumber. It sure looks a lot like the chart of the CME Midwest HR future.
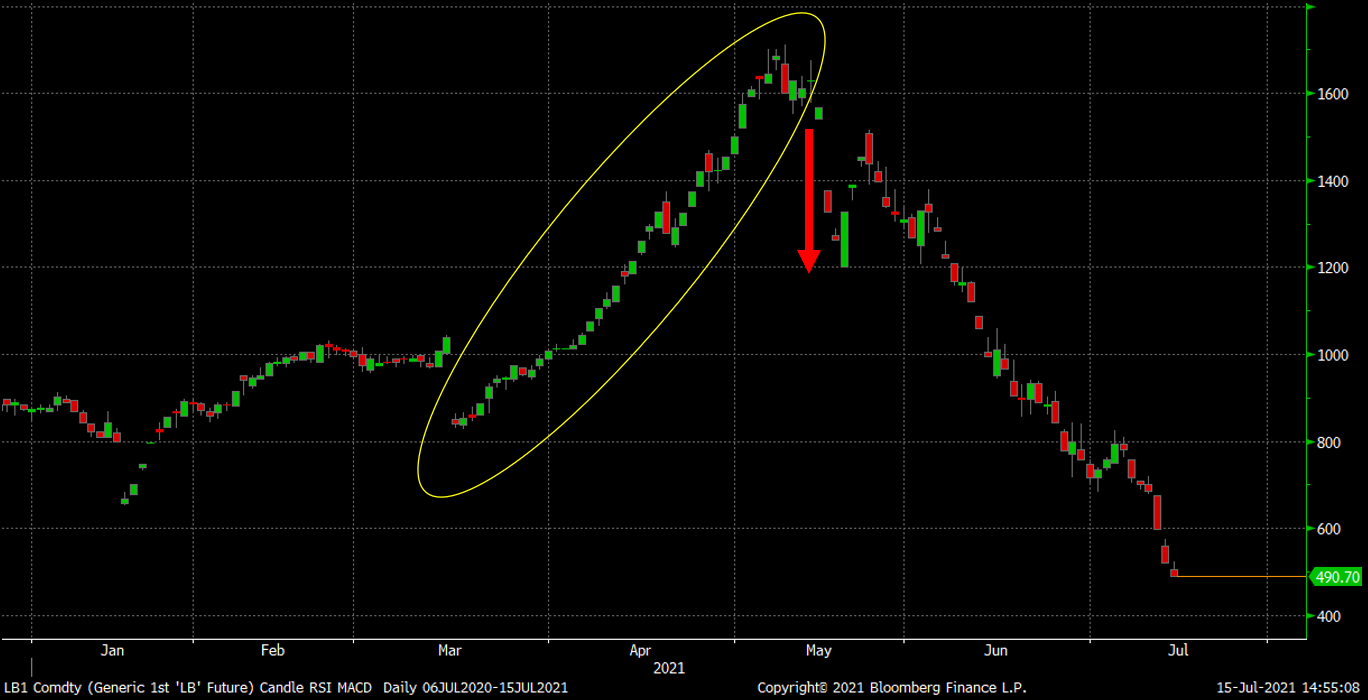
The rolling front month lumber future peaked on May 7 settling at $1,677, last closed above $1,600 on May 13, and since has collapsed. Within 50 trading days, lumber has fallen close to $1,200 or 71%. Notice the gap down to the right of the red down arrow. Whatever triggered the selling, all those buyers bailed. Lumber is a classic example of a bubble both in terms of the steady trading on the way up and the collapse that followed. That’s why the saying goes, “commodities take the stairs up and the elevator down.” Outside of the fact that steel stud sales are likely to lose some market share to wood studs, why does this matter to the steel industry?
Front Month CME Lumber Future
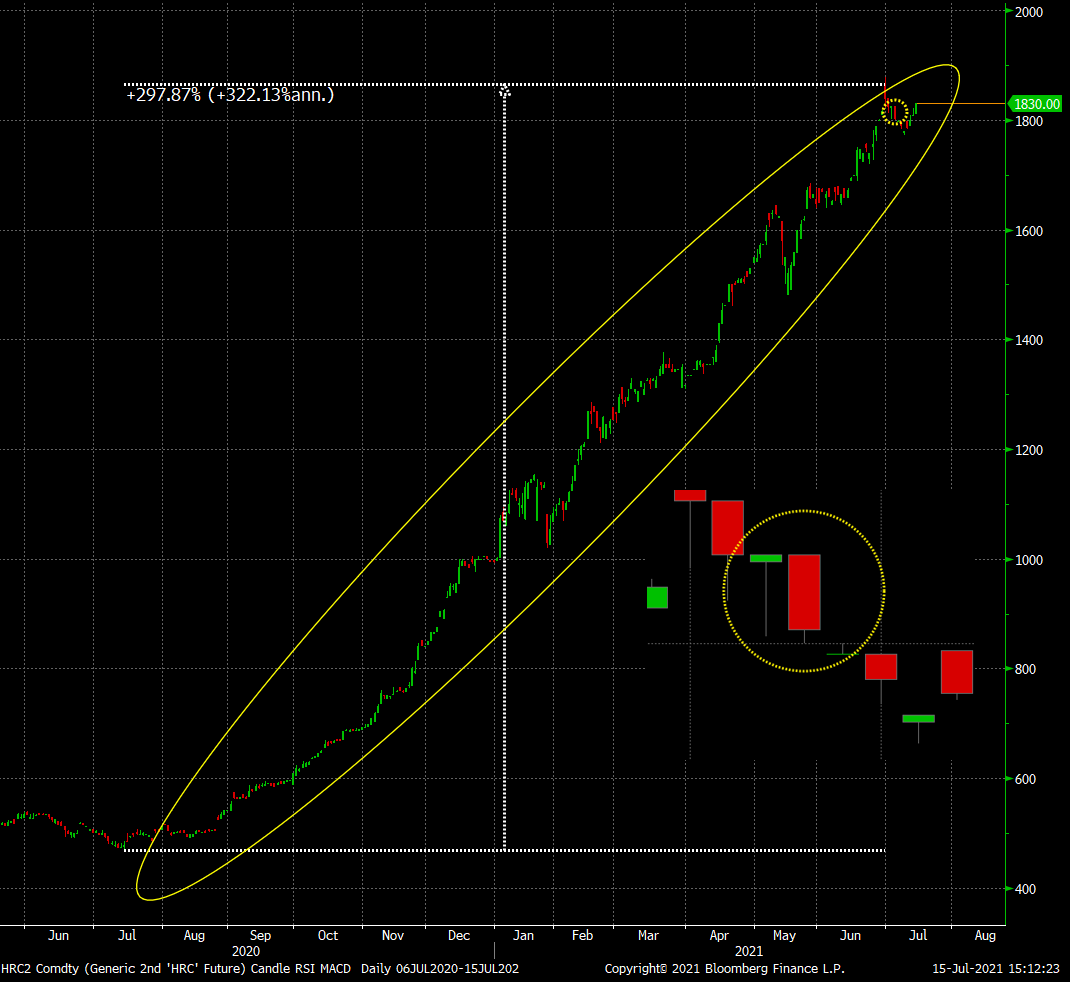
Here is the rolling 2nd month CME hot rolled future chart with the almost 300% rally from last July’s low. The small circle in the top right sitting inside the yellow oval is magnified in the inlet. In the circle is a hammer pattern with downside confirmation, which indicates a potential price reversal. If HRC were to start to decline, would those that had been bidding it up be there to support it or would they bail also? If HRC futures were to collapse by 70% in two months as lumber did, then it would fall to $550/st sometime in September. That would put it about $80 above where it bottomed out in July, actually on July 15, one year ago today. Happy birthday rally.
Rolling 2nd Month CME Midwest HRC
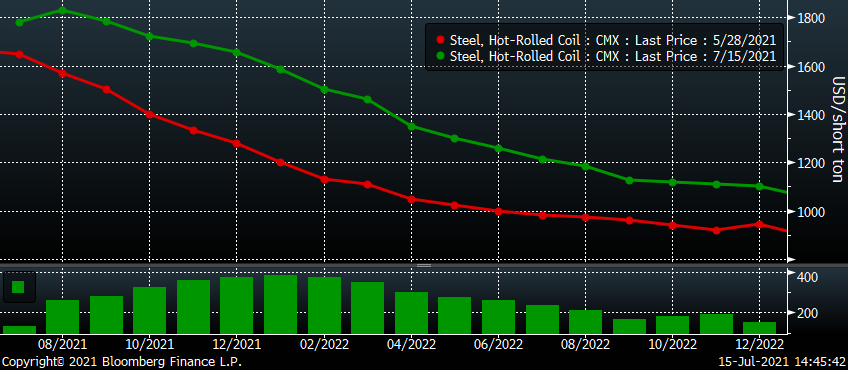
Since the close on the final day of May, the CME HRC futures curve has rallied hundreds of dollars in every month through 2022. The months of November through March saw the largest gains of $350 to $385/st. This has flattened the curve indicating plenty of buyers are still happy to trade the uncertainty of the future in exchange for locking in at a price discounted to today’s spot.
Lumber was in a bubble. It popped and collapsed. Steel is different. Steel is not in a bubble. Steel should be $1,800 per ton. The fundamentals support it, right? Wrong! The price of steel is in a bubble, a bubble that is going to pop at some point.
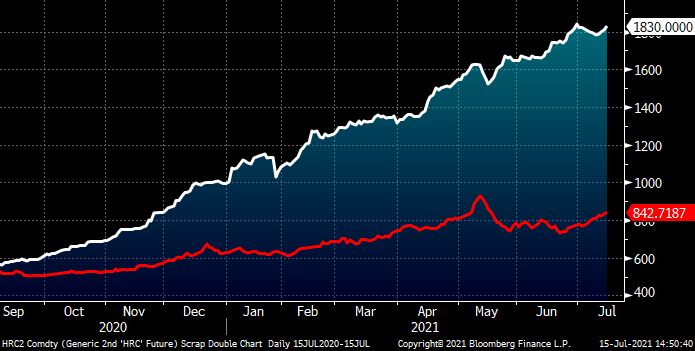
Over the past year, the price of Midwest hot rolled has risen at a much faster rate than hot rolled prices in China and the rest of the world. The price of the August Midwest hot rolled future is almost $1,000 above the August SHFE Chinese hot rolled future.
Rolling 2nd Month CME Midwest HRC (white) & Chinese HRC (red) USD/st
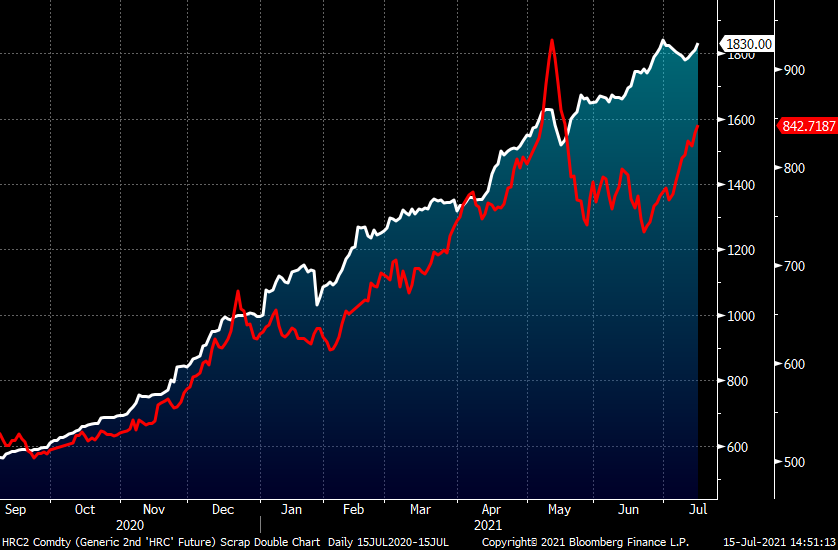
This chart shows the same products as above, but with two different Y-axes to better compare them. In May, Chinese hot rolled declined from its peak and then sat in a range from late May until last week when it rallied above the top of that range. The decline in the price of Chinese hot rolled weighed on hot rolled prices across Asia, specifically the Black Sea, Turkey and Vietnam. During that same time, the price of Midwest hot rolled kept on rallying. The price discrepancy during that time illustrated by the gap in the chart below will translate into even more import tons come September, October and November than there otherwise would have been.
Rolling 2nd Month CME Midwest HRC (white) & Chinese HRC (red) USD/st
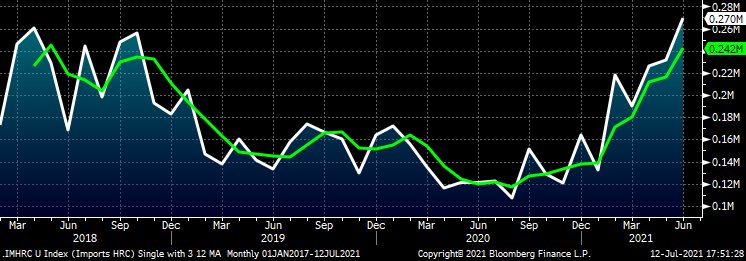
Flat rolled imports updated through June have continued to increase with hot rolled licenses gaining MoM again now to 270k, the highest level in years. Considering the trend and that the spread between international and domestic pricing was attractive in the first quarter forward, flat rolled imports are not only likely to continue to come in at this high rate, but are also likely to increase month after month as the spread continues to expand along with the price of Midwest hot rolled.
Imports – HRC st
Today, we learned there was a sizable increase in service center flat rolled inventory in June, the first material increase since last June. Is this a watershed moment where the data finally moves the other way? Is the shortage over and will future expectations change as tons continue to accumulate in restocking inventory at service centers and OEMs? If yes, will the market lose confidence and buyers step away? If so will that send hot rolled futures down the same path as seen in lumber futures?
Perhaps, but not yet. The aggressive forward buying in CME HR futures continued today. The strength in demand evidenced by the fifth straight month of the ISM Manufacturing PMI above 60 and the continued supply imbalance with domestic steel mills’ backlogs remaining at record highs is likely to keep spot prices elevated.
However, looking further out in time, when will the mills have caught up on their backlog having restocked service centers? Will this coincide with imports flooding in while the new EAF mills get sparked? Could this be around December or early Q1 2022? Despite all of this publicly available information, courageous buyers remain steadfast bidding up Q1, which traded above $1,500/st today. There is a lot of pressure on demand continuing to stay strong. Will the ISM PMI still be above 60 come year-end? That would be quite a feat indeed.
This week, the July CME busheling future settled $19.06 higher MoM at $648.61. NOLA pig iron prices fell $50/t to $625, likely the result of Russians rushing sales out the door to get ahead of higher export taxes being imposed starting Aug. 1. August and September CME busheling futures have fallen $30-$40/GT since the start of July.
August (white) & LME Turkish Scrap Future (red) CME Busheling Future $/lt
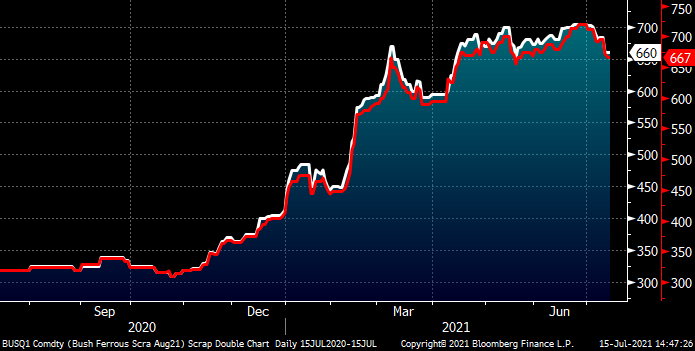
LME Turkish scrap has also seen its front months decline since the start of July with today’s August future settling at $497.
August CME Busheling Future $/gt (white) & LME Turkish Scrap Future $/mt (red)

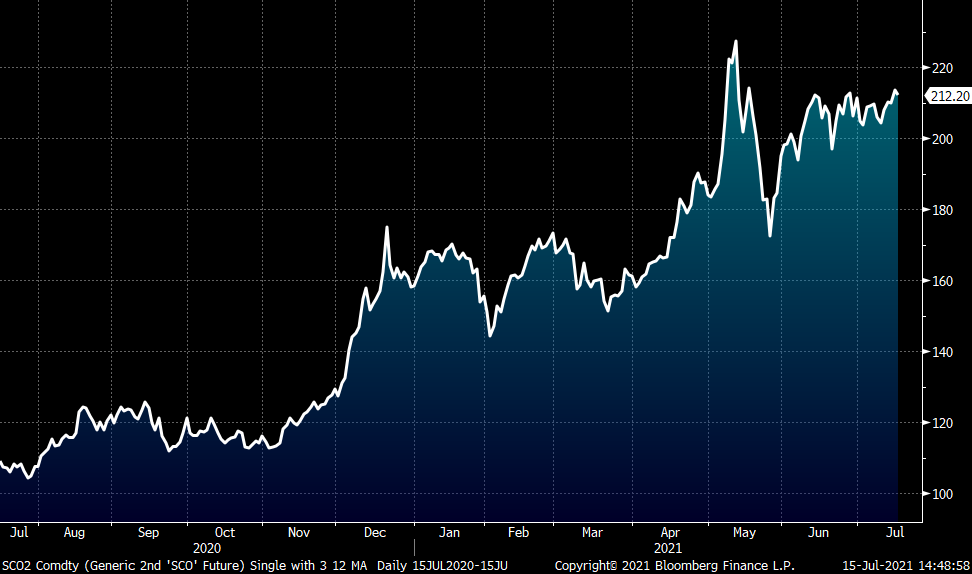
Nevertheless, iron ore continues to remain strong with the rolling 2nd month SGX iron ore future rangebound between $203 and $213/mt.
Rolling 2nd Month SGX Iron Ore Future $/mt
Disclaimer: The content of this article is for informational purposes only. The views in this article do not represent financial services or advice. Any opinion expressed by Feldstein should not be treated as a specific inducement to make a particular investment or follow a particular strategy, but only as an expression of his opinion. Views and forecasts expressed are as of date indicated, are subject to change without notice, may not come to be and do not represent a recommendation or offer of any particular security, strategy or investment. Strategies mentioned may not be suitable for you. You must make an independent decision regarding investments or strategies mentioned in this article. It is recommended you consider your own particular circumstances and seek the advice from a financial professional before taking action in financial markets.


