Prices

October 29, 2020
HR Futures: More Pressure in HR Prices, Little Change in BUS Futures
Written by Jack Marshall
The following article on the hot rolled coil (HRC) steel and financial futures markets was written by Jack Marshall of Crunch Risk LLC. Here is how Jack saw trading over the past week:
Hot Rolled
The latest hot roll production data shows that recent year-on-year figures are off by roughly 20 percent due mainly to the dramatically reduced production in the last 4-5 months. HR imports are near long-term lows due to tariffs and quotas. Mill lead times for flat roll are at long-term highs (reported from 7-12 weeks). Add to this OEM inventories of HR at long-term lows and service center inventories at long-term lows (1.5 MOH recently reported). It also has been reported that 10-15 million annual tons of capacity is in the process of being mothballed. The question everyone is asking after the recent price surge in HR is: How long will the price stay at these elevated levels? The answer depends on how long it will take for the currently crimped supply to match the perceived demand that will result from manufacturing getting back to the new normal production. Pandemic forecasting has been a challenge.
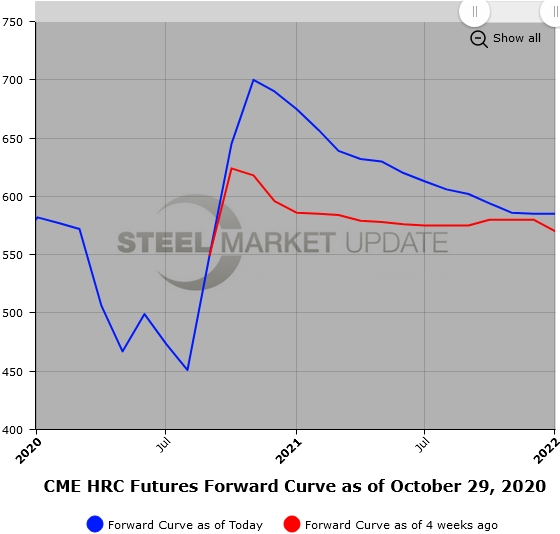
This month, the average spot price for October rose almost another $100/ST for the second consecutive month as spot closed out the month in the mid $680/ST range as offered spot prices were being reported at and above $700/ST. Futures trading this month was brisk as 390,420 ST traded with an Open Interest in HR futures topping out the month at 475,120 ST before shrinking back in the last week to just under 460,000 ST of Open Interest. The futures curve slope shifted noticeably backward in the last month. For example, on Oct. 1, comparison of the Q1’21 HR average price was $585/ST versus Q4’21 HR average price of $580/ST. Just $5/ST of backwardation from Q1’21 to Q4’21. By the end of the month on Oct. 28, the Q1’21 HR average price had risen to $653/ST versus the Q4’21 HR average price of $598/ST for a $55/ST backwardation. Over the month the whole Cal’21 futures curve was higher, but the extreme nearby price rise still left a significantly steeper drop in price the further out on the calendar you looked. For example, the Q1’21 HR average strip price rose $68/ST over the month, the Q2’21 HR average strip price rose $46/ST over the month, the Q3’21 HR average strip price rose $35/ST, and the Q4’21 HR average strip price rose $18/ST over the month.
Below is a graph showing the history of the CME Group hot rolled futures forward curve. You will need to view the graph on our website to use its interactive features; you can do so by clicking here. If you need assistance with either logging in or navigating the website, please contact us at info@SteelMarketUpdate.com.
Scrap
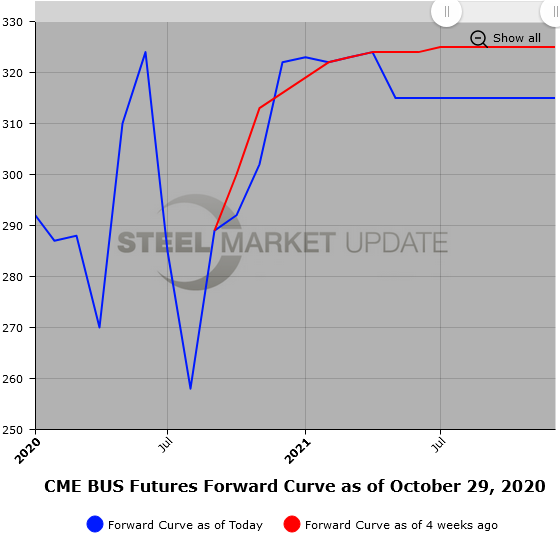
Early chatter had BUS futures trading for Nov’20 at strong sideways, but recent trading suggests that prices could rise $10/GT or more. A few 80/20 export cargoes have recently changed hands in the mid-$290 range. Of note is the very tight spread lately between shred and BUS. The front month BUS has been trading a bit higher recently, around $300/GT. Interestingly, the Cal’21 futures curve has remained relatively flat this month with little noticeable price change. All the contango in the BUS curve is near the front months as Nov’20 vs. Jan’21 have about a $20/GT price pickup with the balance of the Cal’21 curve being basically flat. Of note, the HR minus BUS spread has widened out during the month as the HR price has surged and the BUS price has basically remained unchanged. Cal’21 quarterly average strip prices for the MM spread have widened by $68/ton Q1, $52/ton Q2, $45/ton Q3, and $28/ton Q4’21 over the last month.
Below is another graph showing the history of the CME Group busheling scrap futures forward curve. You will need to view the graph on our website to use its interactive features; you can do so by clicking here.