Prices

October 22, 2020
Hot Rolled Futures: Downside Volatility
Written by Tim Stevenson
SMU contributor Tim Stevenson is a partner at Metal Edge Partners, a firm engaged in Risk Management and Strategic Advisory. In this role, he and his firm design and execute risk management strategies for clients along with providing process and analytical support. In Tim’s previous role, he was a Director at Cargill Risk Management, and prior to that led the derivative trading efforts within the North American Cargill Metals business. You can learn more about Metal Edge at www.metaledgepartners.com. Tim can be reached at Tim@metaledgepartners.com for queries/comments/questions.
Volatility in the futures curve has been significant lately. To be clearer, there has actually been some downside volatility—not just to the upside! Here is something we haven’t seen in a while:
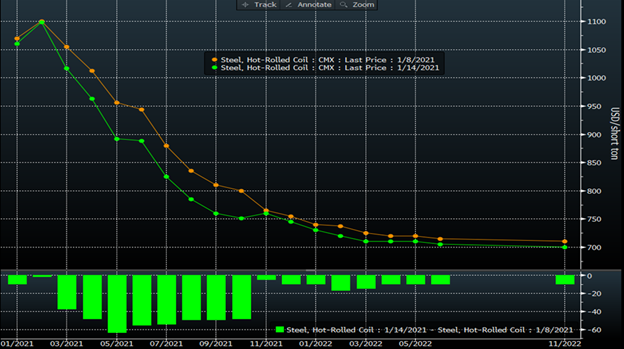
Yes, on a week/week basis, HRC futures actually pulled back after the epic run we have seen over the past few months. May is down over $50! There could be a number of reasons for this. Certainly, the latest wave of Covid cases has some worried about more dramatic shutdowns here in the U.S.—especially with a new administration coming in. However, looking at the Covid case growth here in the U.S., it’s too early to call the top, but the chart below looks like we might be rolling over a bit:
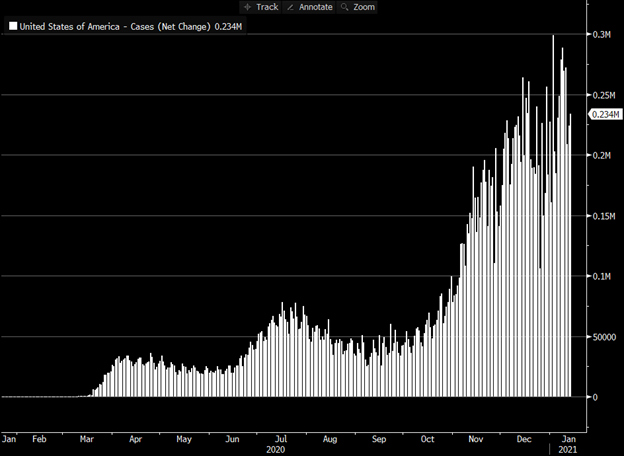
So far, nearly nine million people have been vaccinated in the U.S., and some experts believe that we will be vaccinating one million people per day very shortly. We hope that the feared “post-holiday surge” actually fizzles out—and maybe the recent slowdown in case growth is a sign that this could indeed be happening. However, the pandemic has wreaked havoc on supply chains around the world, and we are seeing some signs that production may be disrupted in some key steel consuming industries. Not necessarily from the inability to get steel, but on shortages of other components. In addition, there has been a rise in cases in China, and it seems to be a new strain of the virus. The Chinese government acted very swiftly to shut things down when the virus first hit in early 2020, so there are some concerns that something similar could happen this time around as well. You can see by the below chart that the Chinese steel futures have pulled back over the past week:
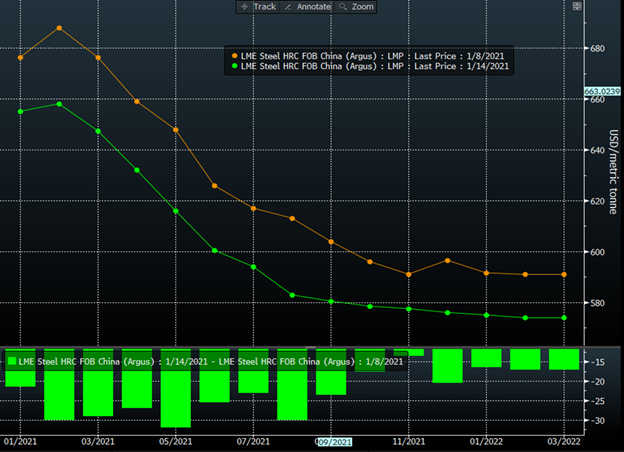
Perhaps some of this pullback could be due to worries about demand if there are shutdowns. However, someone must have forgotten to tell the iron ore traders, as that curve has barely changed, and front month futures prices for ore continue to be very strong:
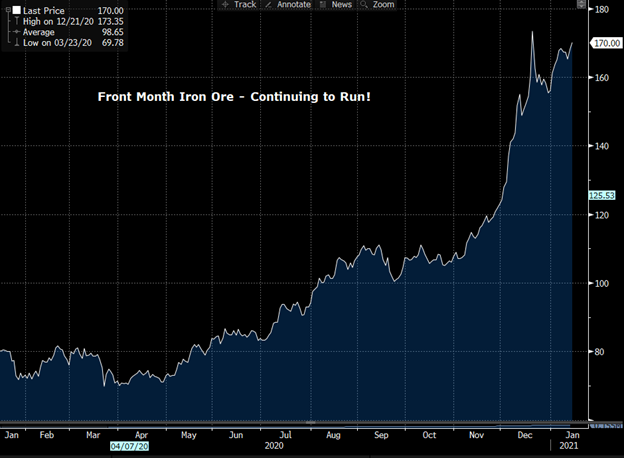
We believe some of the ore strength may be due to seasonal factors. Typhoons have a tendency to hit Australia’s key iron ore and met coal producing regions this time of year, and Brazil is in the rainy season, which can also impact supply. However, if a demand slowdown appears in China, one would have to believe that steel production will come under pressure, and this would also hurt ore demand.
Coming back to the U.S., the backwardation (future months being lower in price than the spot month) in the current HRC curve has some interesting implications. First, let’s look at a chart that compares the front month HRC contract to the 6 month forward contract:
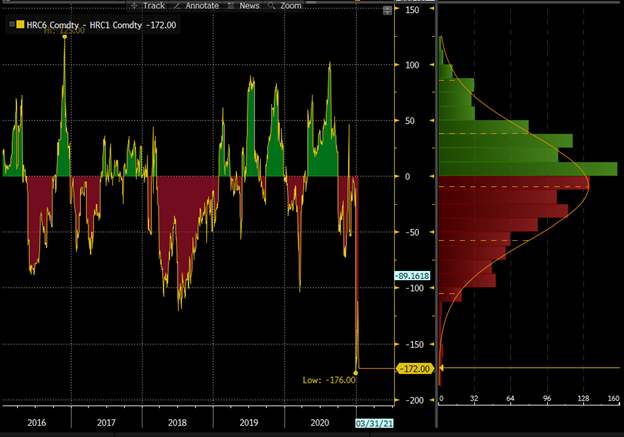
You can see that we are at unprecedented levels of backwardation. This has a few implications. First, if you want to buy imports and use futures to hedge that buy, the market may not give you the opportunity to do so. The farther out months are so much lower than spot that in many cases it’s impossible to hedge your import buy without locking in a loss! This may limit the amount of imports coming in—and actually prolong the current higher price environment! On the other hand, this incredible backwardation can offer some great opportunities to hedge fixed price deals at levels that are way lower than spot. For example, with Thursday’s settlement prices, Q2 is in the range of $915. That is a significantly lower number than the current spot HRC prices we see in the market.
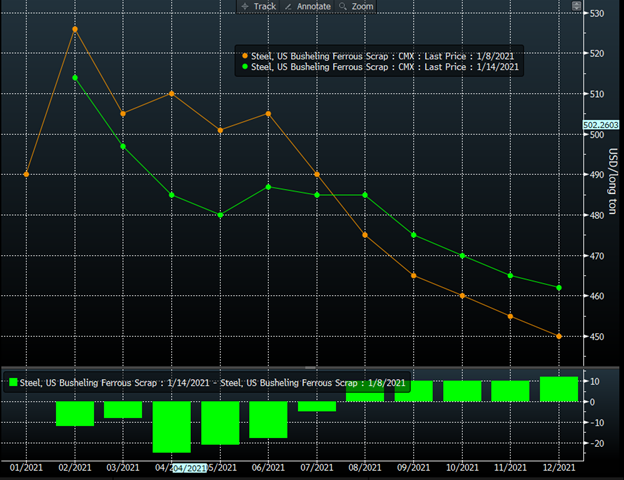
As opposed to the HRC curve, busheling scrap had some months that pulled back, but the curve actually rose week/week in the later 2021 months. Perhaps busheling traders are baking in some of the new EAF capacity that is starting up in late 2021…
We will close this writeup with some comments about volumes. You can see the build in futures volumes over the past year. In total, over 4.4 million tons of steel traded on the exchange last year. Many market participants believe that the volume that trades “over the counter” or OTC is 1-2x the exchange traded volumes. So, if you think about it, there are perhaps 8-12 million tons of HRC futures or swaps being traded out there, so adoption is increasing at a rapid rate.
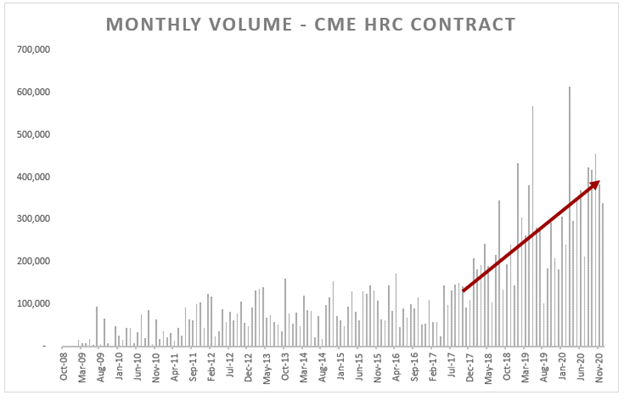
Source: CME
Clearly, more participants are coming into the market—either to manage inventory risk, lock in steel costs or to speculate. If you think about it, it’s critical to watch the futures market given those volumes. If there were an 8-12 million ton steel producer out there, trading steel every day, wouldn’t you want to pay attention? Have a great weekend, and stay healthy!
Disclaimer: The information in this write-up does not constitute “investment service,” “investment advice” or “financial product advice” as defined by laws and/or regulations in any jurisdiction. Neither does it constitute nor should be considered as any form of financial opinion or recommendation. The views expressed in the above article by Metal Edge Partners are subject to change based on market and other conditions. The information given above must be independently verified and Metal Edge Partners does not assume responsibility for the accuracy of the information


