Prices

October 22, 2020
Hot Rolled Futures: Clear as Mud
Written by Tim Stevenson
SMU contributor Tim Stevenson is a partner at Metal Edge Partners, a firm engaged in Risk Management and Strategic Advisory. In this role, he and his firm design and execute risk management strategies for clients along with providing process and analytical support. In Tim’s previous role, he was a Director at Cargill Risk Management, and prior to that led the derivative trading efforts within the North American Cargill Metals business. You can learn more about Metal Edge at www.metaledgepartners.com. Tim can be reached at Tim@metaledgepartners.com for queries/comments/questions.
The futures markets have been exhibiting unusual volatility in the past six months, and while it has continued to some degree recently, this last week was a bit tamer on U.S. HRC (see below chart). In some ways, trends in the U.S. seem to be diverging from what is happening internationally, where we’ve seen some more dramatic moves. Factors driving this vary—from worries of impending oversupply on the one hand, to current shortages of physical material in some areas. Politics have also recently come into play, such as Europe’s offer to remove their retaliatory tariffs if the U.S. were to reverse the Section 232 policy, so you’ve got the makings of some real uncertainty!
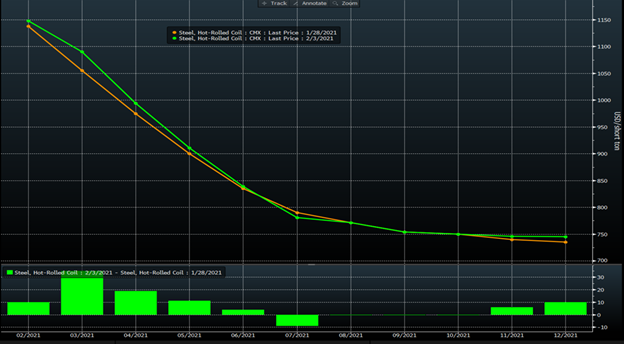
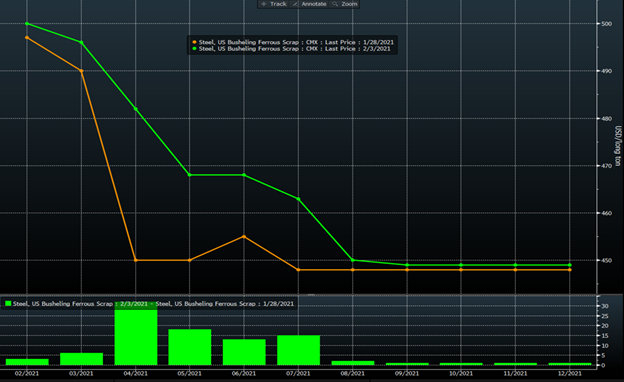
While the March U.S. HRC pushed up $35, you can see that the other months were a bit tamer. U.S. busheling scrap futures actually moved up over the past week, which may surprise some who have heard about the weak market for secondary grades. Some of the speculation of weaker scrap caused the curve to move lower a couple weeks ago, but as it became clearer that prime grades will be more stable, the curve moved back up in the most recent reading.
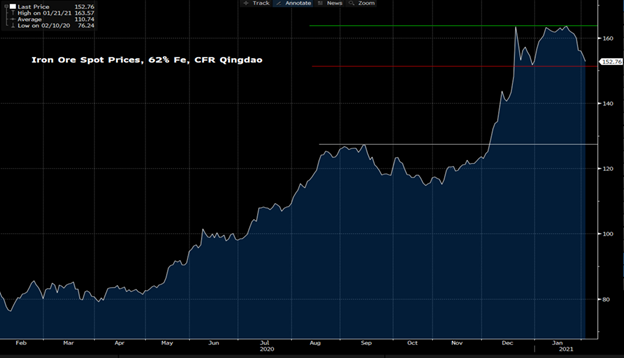
The international scene saw some more dramatic moves. Ore prices have sold off from the mid $160s down to the low $150s. China’s recent rise in COVID cases may be part of the cause. NPR reported that as of Jan. 27, some 45 million Chinese were now on lockdown to try to control the spread, and the government has been encouraging less travel around Chinese New Year as well. This has caused fears of manufacturing disruptions, which could hurt steel demand. Also, there has been talk of steel production cuts that could hurt iron ore demand temporarily. Couple this with some improving shipments of ore from some of the biggest producers, and the lack of a major supply disrupting typhoon hitting key ore producing regions, and you have the makings of a price correction. The ore chart below is interesting, as we’ve formed a bit of a “channel” between the low $150s and $160s. Technicians would normally indicate that a breakout from this channel in either direction is meaningful (or a breakdown).
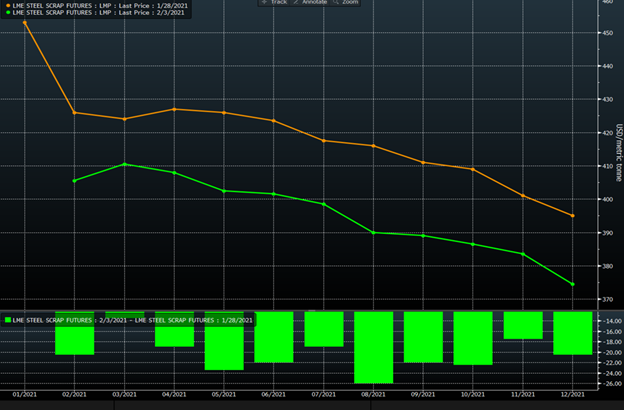
Turkish scrap has also had a meaningful pullback, as some recent spot deals have been significantly lower versus month-ago levels. The curve hasn’t pulled back as much as the spot deals, but it has been under some pressure. Some market participants look at this as an important change in trend, while others have said that the re-emergence of China in the seaborne scrap markets may provide some support as they look to import more material from around the world. Export price offers on HRC from China have also pulled back roughly $40 from the highs, perhaps in tandem with the ore move.
All told, U.S. HRC market participants are struggling to factor in many different considerations. On the bullish side, inventories appear to be quite low at most service centers judging by the publicly available measures, and some OEMs complain of very tight supplies. On the bearish side, many think that prices are just too high and must come down. The backwardation (forward prices being lower than front month prices) is at unprecedented levels because of this skepticism. Check out this spread chart between the current month contract and the contract six months forward:
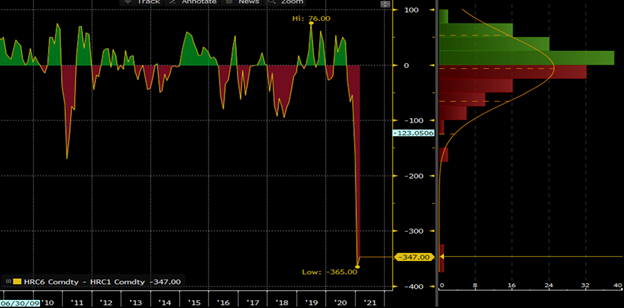
Traders appear to be betting that mill restarts and new capacity will bring about a large correction—and you can see that we are at levels of backwardation that are roughly 2X the prior record! In addition to the potential for new supply, people are worried the chip-shortage-related auto shutdowns may bring about some slowing in demand as well. It remains to be seen if this backwardation is actually going to play out or if the strength will “roll forward” as we move further into 2021.
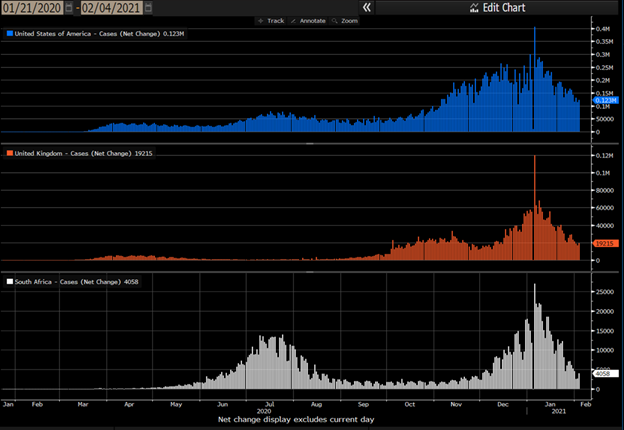
We thought a few comments on the virus were worth sharing this week. The chart below shows new case growth, and it looks like the virus in the U.S. is in full retreat as daily new cases are dropping dramatically. We also threw the UK and South Africa in here, since those areas are supposedly early in seeing new, more virulent strains of the virus becoming more widespread. Despite this, cases are also dropping dramatically there, which is very good news.
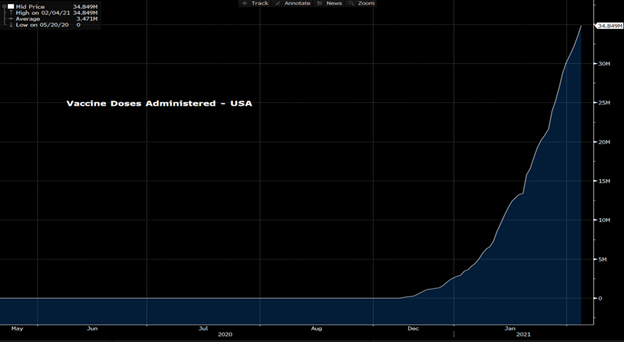
The chart below is of vaccines administered in the U.S. This chart is “roofing,” which is also great news. Maybe it’s not going up as fast as GameStop did last week—but it’s a beautiful looking chart.
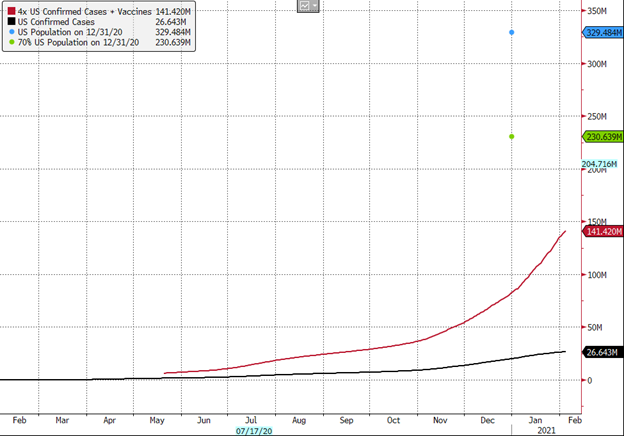
We’ve done some rudimentary math on “herd immunity” here in the U.S. as follows. In several publications, medical professionals have said that for every reported case of COVID-19, there are as many as three more out there that didn’t get reported. So, if we take the total number of reported cases in the U.S., and assume three other cases for each reported one, that means over 100 million of us have had the virus so far. Add to that the 35 million vaccinations that have happened so far, and that means that nearly 43% (out of a total population of 330 million) have already had it or have been vaccinated. Several medical professionals also suggest that when we reach 60-70%, we will indeed be close to herd immunity here in the U.S. So, we may be closer to that than is commonly perceived.
In fact, some have suggested that North and South Dakota are at the 60% threshold, and new case growth has collapsed:
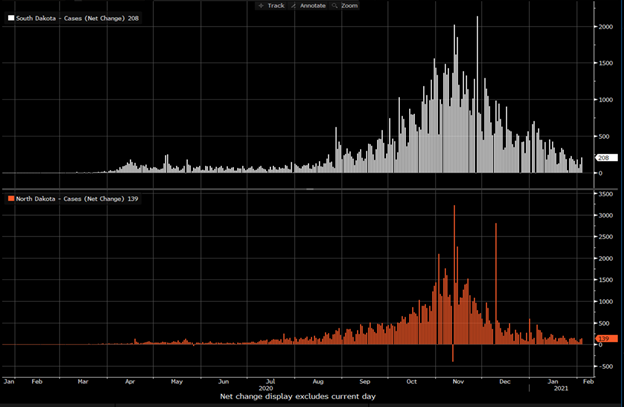
This has dramatic implications for the economy, and we should witness some major changes in behavior once we get to that point more broadly here in the U.S. Let’s hope that this is the beginning of the end for the virus!
Disclaimer: The information in this write-up does not constitute “investment service,” “investment advice” or “financial product advice” as defined by laws and/or regulations in any jurisdiction. Neither does it constitute nor should be considered as any form of financial opinion or recommendation. The views expressed in the above article by Metal Edge Partners are subject to change based on market and other conditions. The information given above must be independently verified and Metal Edge Partners does not assume responsibility for the accuracy of the information


