

Market Data

December 30, 2019
CRU: 2019 Surprises—Trade War Hits the Gas as Autos Pull the Handbrake
Written by Jumana Saleheen
By CRU Chief Economist Jumana Saleheen, from the CRU Steel Sheet Products Market Outlook
Global Economic Outlook: 2019 has been an eventful year. Many decisions were taken, including tariffs and monetary policy easing. Other decisions were put-off, such as Brexit and auto tariffs.
Looking back to our expectations at the start of 2019, four things have surprised us:
• The global automotive market underperformed expectations in 2019, due to a confluence of cyclical and structural factors.
• The trade war outlook and average bilateral tariff rates between the U.S. and China have increased by more than we had expected this year (despite the phase 1 deal).
• Because of its greater exposure to both imports and exports, European growth was more negatively impacted by the trade war, auto sector weakness and Brexit.
• The dollar has remained stronger for longer, which, based on historical correlations alone, would point to relatively weaker commodity prices.
Auto Industry Hurt by Environmental Standards and Cyclical Weakness
In December 2018, we were relatively optimistic about the prospects for the vehicle market in 2019. Global production of cars and commercial vehicles combined (i.e. autos) was expected to grow by just over 1 percent y/y. Our most recent estimate is much weaker and suggests a 4.5 percent contraction in output in 2019, primarily driven by weakness in China and Western Europe.
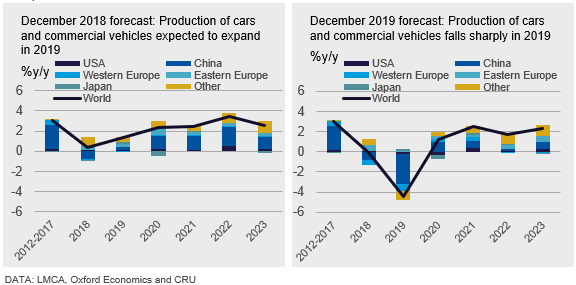
The auto industry’s weakness in 2019 can be explained by three factors: uncertainty, weak cyclical demand and weak structural demand.
First, the new auto emissions standards in China, India and Europe created uncertainty for both producers and consumers. In terms of output, many cars failed the new tests, creating production backlogs and delays. Consumers hesitated to buy, wondering for how long a car meeting the old standards could be used. With the benefit of hindsight, it is now clear that even though the emissions standards were pre-announced, all parties underestimated the disruption that would follow. Fortunately, although uncertainty typically generates a temporary fall in demand, once the uncertainty dissipates, the demand returns. Indeed, that is a key reason why we expect global auto demand to recover in 2020.
Second, due to cyclical weakness, economies such as China and Europe have experienced somewhat slower growth than expected in 2019, leading consumers to postpone auto purchases. It is harder to know when this cyclical weakness may end, but in our forecasts, output does not return to 2018 levels until around 2024.
Third, the auto industry faces profound structural challenges. Many European countries (e.g. Germany and Denmark) have pledged to ban the use of vehicles using fossil fuel starting in 2030. The direction of travel for the auto sector from a consumer and government policy perspective is clear: away from internal combustion engines (ICEs) and towards electric vehicles (EVs). The implications of this shift are that the auto industry may have to speed up its investment strategy to make this transition possible by the stated deadline.
Overall, we still expect the auto industry to recover in 2020, but given what we are hearing from our industry contacts, the risks here lie, on balance, to the downside.
A Bleaker Trade War Outlook Than Our Base Case Forecast
We correctly predicted that the U.S.-China trade war would rumble on in 2019 and we captured the extreme risks of higher tariffs in our downside risk scenario—A trade spat could shave a percent of global growth. However, our base case did not factor in two developments: a broader range of goods are now under tariff, with the total value of tariffed Chinese goods rising from $250 billion to $370 billion, as well as a rise in the rate of tariff on goods already under tariff.
The surprise in the trade war escalation is perhaps best summed up by the Peterson Institute, which notes that the average U.S. tariff rate on Chinese goods in 2019 increased to almost twice the level in 2018. That is higher than what our base case envisioned and illustrates the steady pace at which trade war escalation has taken place.
In addition, the medium-term trade war outlook is now worse than what we had expected at the start of 2019 (see “November Global Economic Outlook: Key Calls for 2020”). Not only do we expect the trade war to continue to rumble on, we also expect it to broaden in scope: from trade and technology to financial and labor markets. We, and others, have referred to this as a “de-coupling” of the U.S. from China, which threatens to slow the pace of “catch-up” growth in China that typically arises as developing economies share and transfer knowledge from other advanced economies. This is likely to lower the rate of medium-term growth in China than it would have been absent the trade war. This view is unchanged by the phase 1 deal, which was in line with our expectations (see “Official ‘Phase 1’ deal clears the way for expanded trade in 2020”).
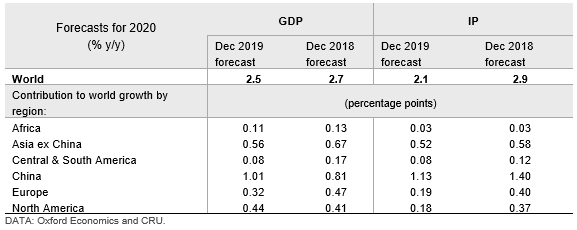
Europe is the Main Casualty of the Global Growth Slowdown
Compared to one year ago, we have revised down our world GDP growth forecast to 2.5 percent, from 2.7 percent, with the biggest downgrade attributed to Europe. There have been significant downgrades to industrial production, too.
The casualty of the trade war, and broader slowdown in world trade, is Europe, and within that, the Eurozone. The EU is very exposed to trade, with EU exports accounting for nearly 50 percent of GDP, compared to 14 percent in the U.S. and 20 percent in China. It appears that we, and other forecasters, have underestimated the negative impact on EU trade flows that followed from the trade war, Brexit related uncertainty, and the weakness in the manufacturing sector (including the auto industry). As a result, EU GDP and IP in 2019 were weaker than initially projected. This weakness follows despite the ECB responding to the negative news by cutting interest rates in September and restarting quantitative easing in November.
The second most important region for the downgrade is Central and South America, where the underperformance can be explained by a variety of country-specific political and economic developments, though the trade war is certainly a contributing factor.
It is, perhaps, surprising that growth rates in the U.S. and China were not downgraded despite being directly impacted by the U.S.-China trade war. This is because in China, much of the trade war weakness has been successfully mitigated through fiscal policy whereas, in the U.S., the offset has come from easier U.S. monetary policy (and Fed balance sheet easing in response to liquidity problems in the market), as well as faster than expected growth momentum on the part of consumers during 2019.
Dollar Strength Has Surprised on the Upside
At the start of the year, we expected the dollar to decline in 2019 and 2020, but mid-year we changed our call to the dollar remaining broadly stable out to 2020 (this was despite our expectation of the Fed rate cuts). The reason we changed our view was the escalation of the trade war, and the associated increased demand for the dollar given its role as a safe-haven asset during times of uncertainty. Moreover, the U.S. stood out as likely to be one of the best-performing advanced economies.
What does this mean for our clients in the metals, mining and fertilizer industries? The relationship between the dollar and different commodity prices is complex and will depend on why the dollar moved in the first place (or what economists call the source of the shock).
Given that dollar strength can be explained by its role as a safe-haven currency, it follows that the prices of precious metals, such as gold, which are also considered safe-haven assets, have also increased by more than expected.
The impact on other commodity prices is less clear cut. That said, historically, there is a negative correlation between the value of the dollar and average commodity prices. That is, a strong dollar signals weaker commodity prices, and vice-versa. If that historical relationship were to continue, then continued dollar strength would translate into continued commodity price weakness, on average. The implications for different commodities, and the countries and mines in question, can be worked out from CRU’s various cost models and our exchange rate scenario tool.
2019 has lived up to its promise for being an eventful year. Some key issues, namely Brexit and U.S. auto tariffs, were postponed. Others, specifically the trade war, came to a head, weighing on growth in key economies and sectors. 2020 promises to be equally exciting as we observe whether our prediction of a pickup in H2 2020 comes to pass.
Request more information about this topic.
Learn more about CRU’s services at www.crugroup.com

