Prices

October 24, 2019
Hot Rolled Futures: Price Increase Pushes Futures Higher
Written by David Feldstein
The following article discussing the global ferrous derivatives markets was written by David Feldstein. As an independent steel market analyst, advisor and trader, we believe he provides insightful commentary and trading ideas to our readers. Note that Steel Market Update does not take any positions on HRC or scrap trading, and any recommendations or comments made by David Feldstein are his opinions and not those of SMU or the CRU Group. We recommend that anyone interested in trading steel futures enlist the help of a licensed broker or bank.
Despite a sharp drop in this week’s CRU Midwest HRC index, CME HRC futures settled slightly higher Wednesday night leaving market participants scratching their heads. Today, ArcelorMittal’s $40 price increase announcement answered those questions. In the days to come, expect higher futures prices in response, especially in the front months, as short covering is met with sellers in retreat. This chart shows the over 18 month bear market in the rolling 2nd month CME Midwest HRC future (HRC2).
Rolling 2nd Month CME Midwest HRC Future
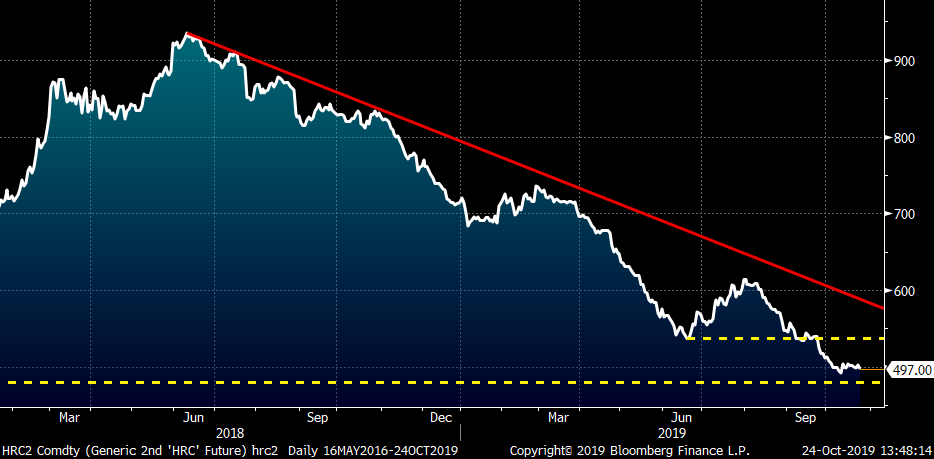
Will this price increase take hold? If it does, has the bottom been put in, is the bear market over and is Midwest flat rolled on the cusp of a bull market?
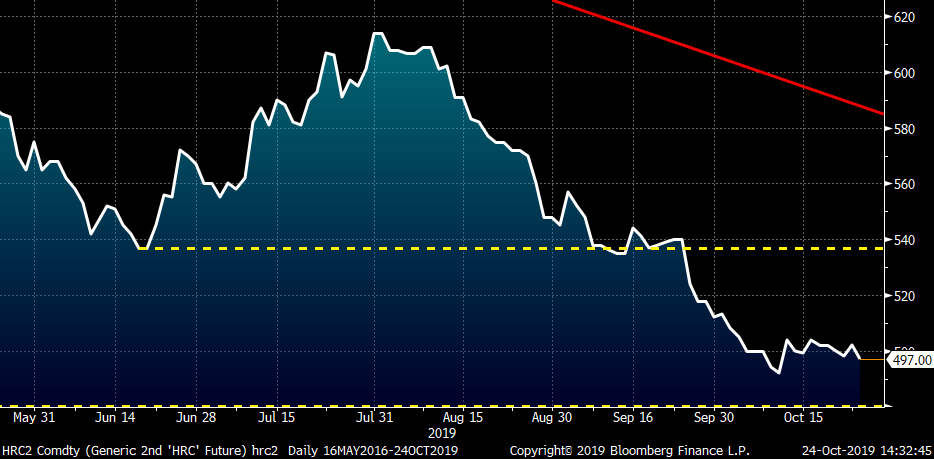
I remain skeptical. This chart zooms in on the one above. As you can see, HRC2 has fallen roughly $40 since breaking below the $535 support level at the end of September. Was this enough of a sell-off to entice large buyers to step in? Have fundamentals improved significantly enough to change market sentiment? Where was the capitulation that typically accompanies the end of a bear market? Was the lack of this capitulation a sign of things to come?
Rolling 2nd Month CME Midwest HRC Future
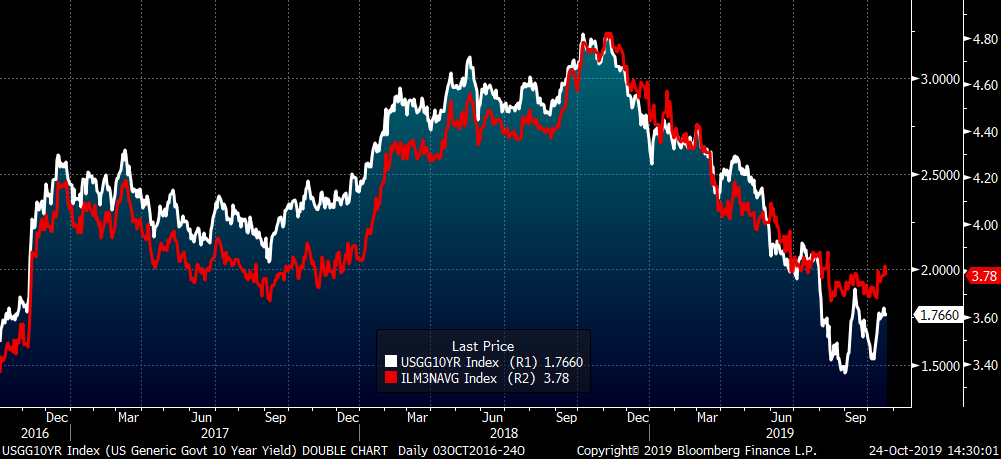
As discussed last time, interest rates have fallen dramatically and should provide a boost to the global economy and the construction sector.
U.S. 10-Year Treasury Rate (white) & Bankrate.com Avg. 30 Year Mortgage Rate (red)
The U.S. dollar has finally broken its fever, but still remains elevated at 97.6. This could be a good sign of things to come if it means further depreciation, but an index at 97.6 is still a headwind for commodity prices.
U.S. Dollar Index

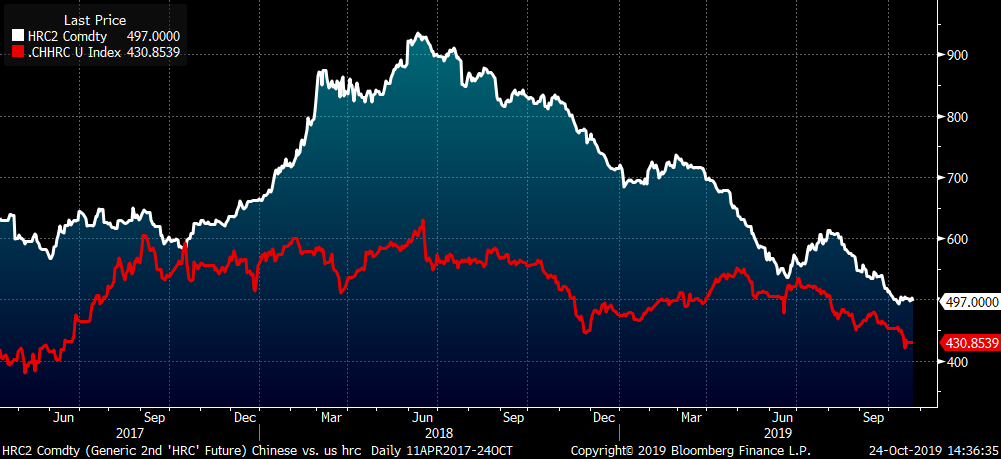
Using the differential between Chinese and Midwest HRC, we can assume imports will remain a nonfactor. However, imports have been a nonfactor all year. The drop in imports was met with a drop in exports, which looks to be causing more problems for Midwest prices.
Nov. CME Midwest HRC Future $/st vs. SHFE Chinese HRC Future $/st
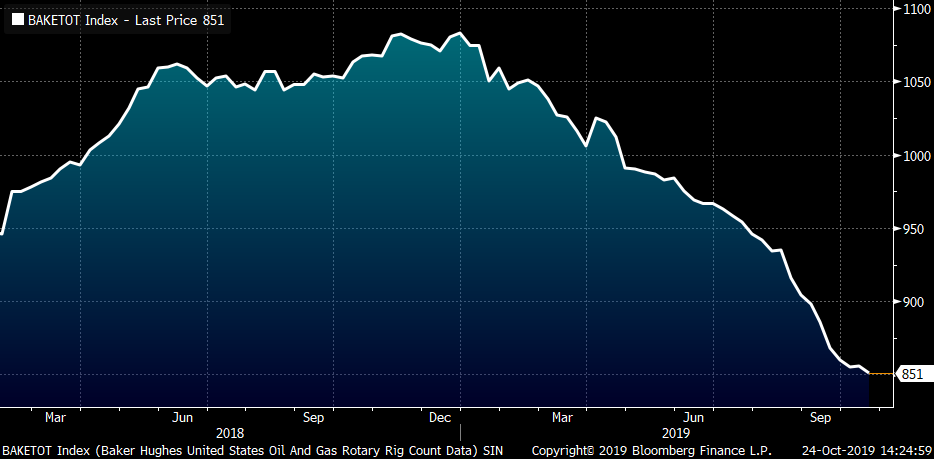
The rig count has plummeted this year and steel demand from the energy industry has fallen with it.
Baker Hughes U.S. Oil and Gas Rig Count
In September, AISI U.S. crude steel production broke below its long uptrend offering a glimmer of hope, but has since bounced back above it.
AISI U.S. Crude Steel Production

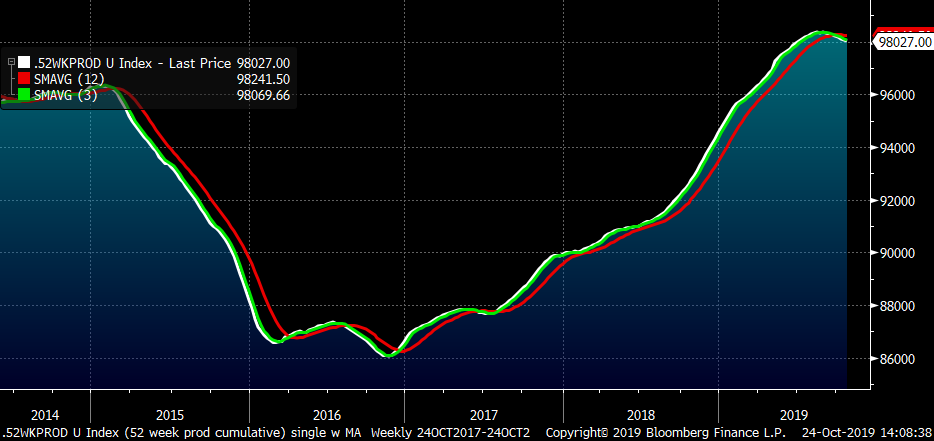
This chart is a moving sum of 52 weeks of AISI crude steel production and while the three-week moving average has finally crossed below the 12-week moving average (indicating production will start to drop) for the first time in years, the metric still remains extremely elevated. The bottom line is production has remained stubbornly oversupplied and with all of the additional capacity coming online in the coming months and years, it will be hard to revive steel buyers’ animal spirits.
AISI U.S. Crude Steel Production 52-Week Sum
Taking a step back, you can see the staunchly entrenched downtrend remains. All of this makes for a very tricky time, especially when considering the time of year. There are only four weeks until Thanksgiving followed by holiday parties, vacations and then its 2020. It’s high time for service center destocking to avoid end-of-year taxes. This is the reality and it’s tough surf to sell a price increase. Moreover, if the price increase fails, look out below.
Rolling 2nd Month CME Midwest HRC Future

So, where are the opportunities for those with inventory and downside price risk?
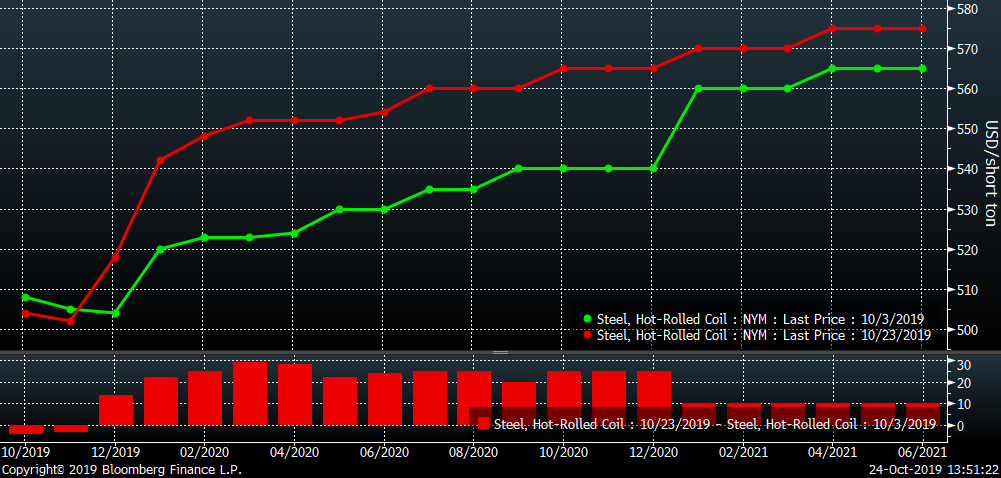
1) Over the last three weeks, the curve has rallied $20-$30 across 2020. Take advantage of the steep contango by loading up on physical and selling Q1, Q2 or Q3 futures if you can lock in $100 or more. For those buyers who have CRU minus deals, this can be accomplished immediately for October tons and also look opportunistically at November’s tons (i.e.) if you can sell at $580 or higher you should be in great shape. Take profits while you can because if this bear (market) is about to hibernate and enter into a new bull market, there will be plenty of profits to come.
2) Calendar spread mania! Buy the front and sell the back if you can capture $30 buying Dec and selling Q1. Buying Q1 and selling Q2 for $5-$10 could be a good trade as well if a sharp rally occurs with the assumption that the curve will shift into backwardation (downward sloping) due to expectations of headwinds due to additional new capacity coming online eventually stymieing the rally.
3) That red downtrend in the chart above is a bright line that can provide a solid map to trade off of. Target sales in the $560-$580 range in Q1/Q2 and if HRC2 breaks above the red downtrend line, take your loss and exit the trade. I would expect the contango flattens if HRC2 rockets higher. But if this price increase fails and there is an end of the year rout, what a difference that hedge will make to your year. Perhaps a $60-$100 profit can be expected vs. a potential loss of $20; 3:1-5:1 risk reward ratios are strong moves in the trading world.
CME Midwest HRC Futures Curve
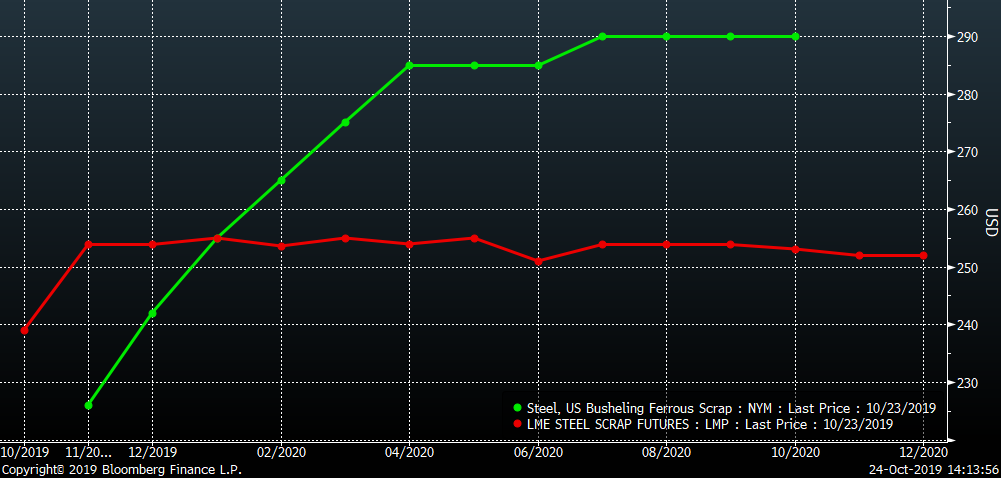
Taking a look at the scrap market, 2nd month busheling and Turkish scrap have rallied slightly, but both remain in an even longer bear market than HRC.
2nd Month CME Busheling (white) & 2nd Month LME Turkish Scrap (red)
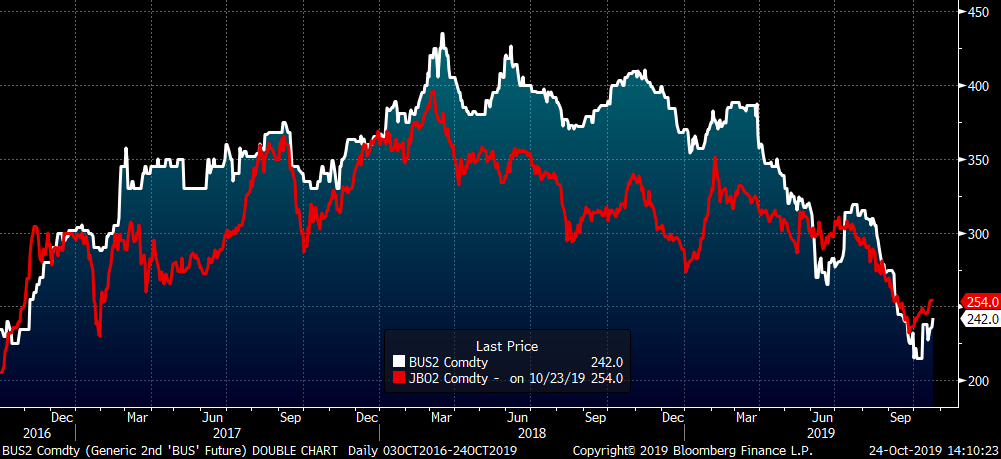
4) Buying nearby busheling and selling nearby LME Turkish scrap futures isn’t as attractive as it was three weeks ago, but buying December-February busheling vs. Turkish scrap for even is still a solid way to play a rally in Midwest HRC without taking the same relative risk as buying outright futures.
5) Buying the calendar spread in CME busheling is another avenue to consider. Look at that contango! Unfortunately, that might be a result of the illiquidity in busheling and both 4 and 5 might be a challenge to get executed.
LME Turkish Scrap & CME Busheling Futures Curves
I wanted to take a moment to thank John Packard for allowing me to contribute these articles all these years (nothing is changing btw). I have been surprised and humbled whenever I meet someone in the industry and they tell me they enjoy reading my articles. I enjoy writing them and hope they have been helpful for you.
Let’s hope 2020 is a much easier year!!!