Prices

October 3, 2019
Hot Rolled Futures: Seeking Support After Breaking Below $535
Written by David Feldstein
The following article discussing the global ferrous derivatives markets was written by David Feldstein. As an independent steel market analyst, advisor and trader, we believe he provides insightful commentary and trading ideas to our readers. Note that Steel Market Update does not take any positions on HRC or scrap trading, and any recommendations or comments made by David Feldstein are his opinions and not those of SMU or the CRU Group. We recommend that anyone interested in trading steel futures enlist the help of a licensed broker or bank.
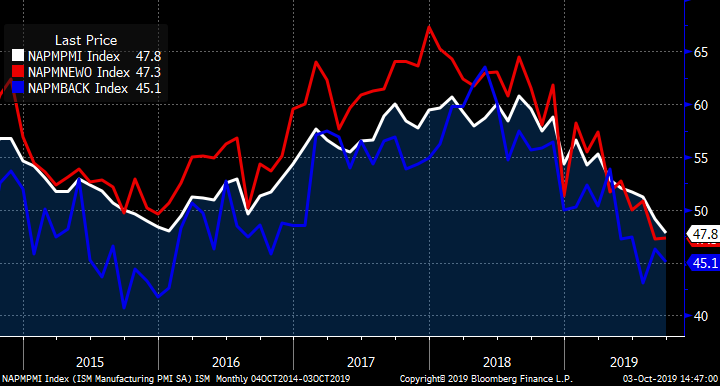
The September ISM Manufacturing PMI fell to 47.8 with the new orders sub-index at 47.3 and the backlog sub-index at 45.1. One could characterize this data as dog meat. That’s right, it’s downright awful, but that might be good news. Steel is a commodity and subject to cycles and mean reversion. It’s been a long year and many in the space probably feel like Rocky did at the final round of his first fight with Apollo Creed, but remember Rocky’s goal was simply to go the distance. Winter is coming and hopefully this bear market is heading into hibernation. While there is have been plenty of disappointing economic and fundamental data points released, some are starting to indicate better days ahead.
ISM Manufacturing PMI, New Orders Sub-index (red) & Backlog Sub-index (blue)
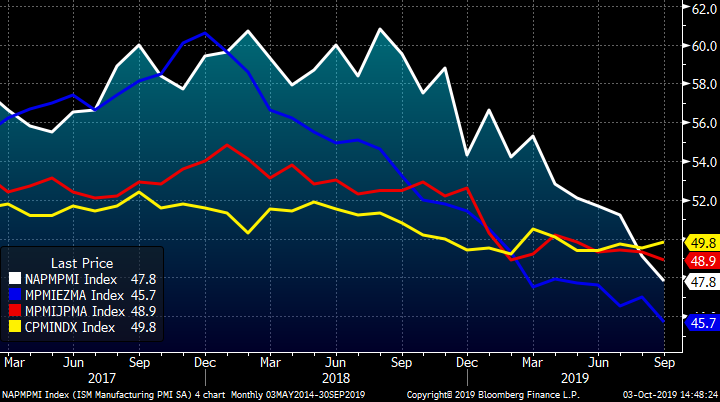
This chart shows the manufacturing PMIs for the four largest global economies, which are all in contraction. China’s PMI actually inched up this month as the lone bright spot. China can spark a massive global rally in steel prices given the right conditions as it did in early 2016.
Manufacturing PMIs for U.S. ISM (white), Eurozone (Blue), Japan (red) and China (yellow)
Unfortunately, the bear market has to run its course first. Since the last article, Midwest HRC prices have fallen below the $535 support level from this past June.
Rolling 2nd Month CME Midwest HRC Future

Typically, when a bottom doesn’t hold, then a steep price drop must occur to induce buyers to take on price risk. Moreover, bear markets typically end with capitulation. Those size buyers that set the June floor purchasing physical Midwest HRC at $480-$520 are unlikely to take another swing at the same price, especially considering the calendar (i.e.) the steel would arrive in November and December.
Going back to 2015, we see the next support level is around $480 and then the $380-$400 level below that. In other words, buckle up; a sharp drop for flat rolled prices in Q4 is likely.
Rolling 2nd Month CME Midwest HRC Future

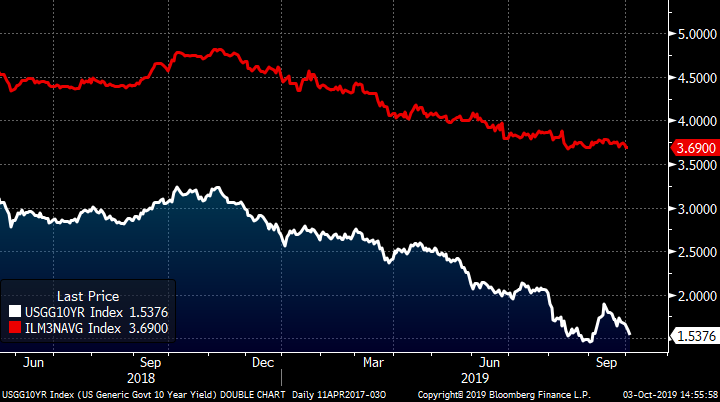
As mentioned above, there are some positive fundamental developments. First, the sharp drop in interest rates will spur broad-based economic growth as time goes on. Since last October, mortgage rates have fallen almost 100 basis points and the U.S. 10-year Treasury rate has fallen over 150 basis points. This decreases interest expense in the industry while also allowing businesses and homeowners to refinance, decreases the costs of fixed asset investment, transactions, business start-up costs, etc., and new home purchases.
U.S. 10-Year Treasury Rate (white) & Bankrate.com Avg. 30-Year Mortgage Rate (red)
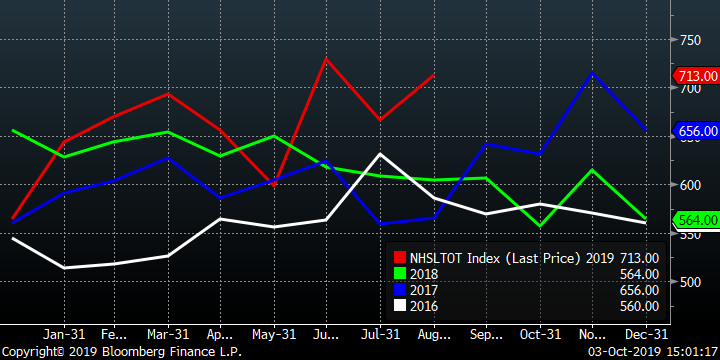
These next two charts show YoY monthly data with 2019 in red. New home sales and building permits shot up in August, which should be a boon for the economy. The drop in interest rates being followed by an uptick in residential real estate data signals the lower rates are having the positive effect they should.
U.S. New Home Sales SAAR
U.S. Building Permits SAAR

However, the sharp move lower in WTI crude despite the attacks on the Saudi oil fields…
CME Rolling Front Month West Texas Intermediate Crude Oil Future
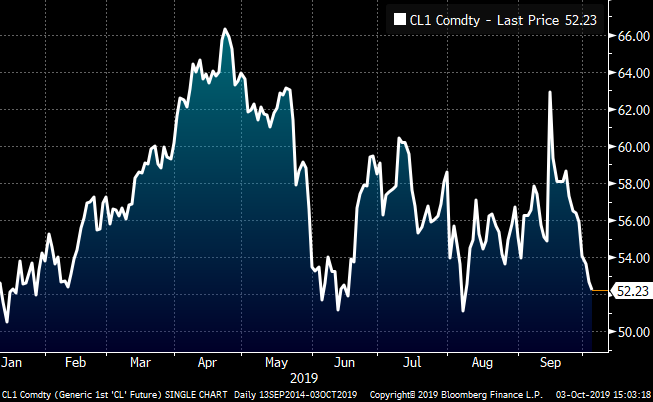
…and the U.S. dollar near multi-year highs are frustrating headwinds.
U.S. Dollar Index

AISI U.S. crude steel production has finally broken below the uptrend that started in late 2016. Perhaps the cumulative supply taken offline from Q4 planned outages will help reconcile some excess inventory at the mills into year end.
AISI U.S. Crude Steel Production
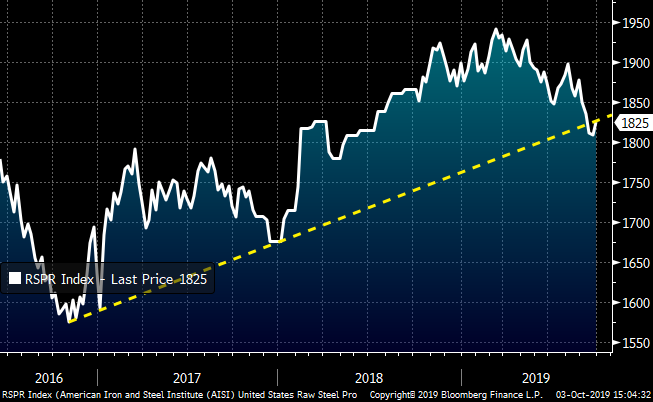
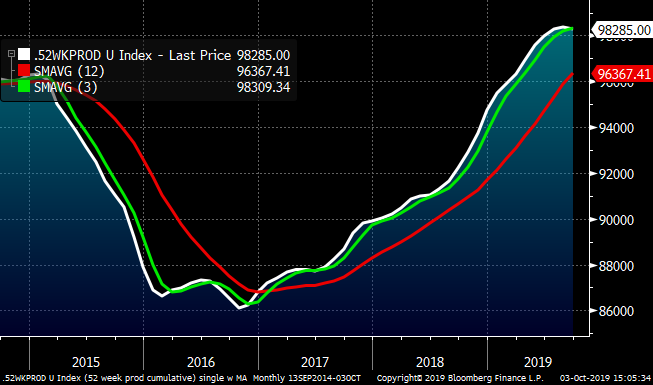
A sustained decrease in domestic crude steel production would be a welcome development for steel prices. While the weekly AISI data has trended lower, the cumulative 52-week moving sum remains near its highs. Much of this chronic oversupply has been a result of a domestic steel mill turf war, a sharp drop in steel exports and slowing demand. Skepticism regarding domestic mill production discipline is warranted, especially considering the relentless additional capacity being added in the coming months and years. However, perhaps U.S. Steel will follow up its investment in Big River with announcements of capacity being taken offline.
AISI U.S. Crude Steel Production 52-Week Sum
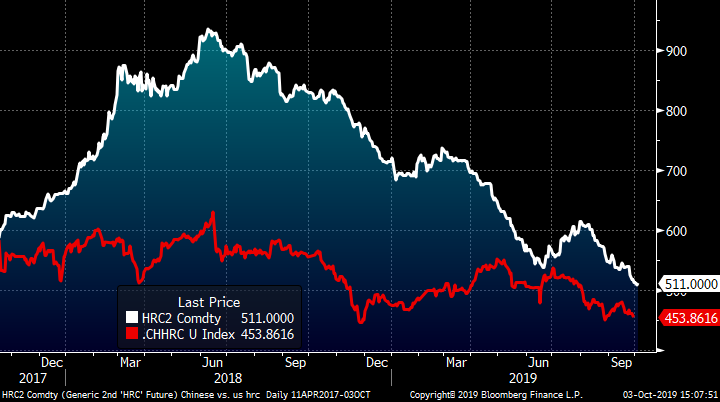
This chart shows the differential between 2nd month CME HRC and Shanghai Futures Exchange Chinese HRC futures, both in dollars per short ton. The differential has compressed to $58 and is a good indication that unattractive import orders will provide some support for domestic mills in the coming months.
Nov. CME Midwest HRC future $/st vs. SHFE Chinese HRC Future $/st
Feeling confused? The thing to keep in mind is that the low hanging fruit has been picked and HRC is getting into a much trickier area to manage. Anything can happen, but my best guess is prices fall rapidly in the coming weeks or months, find a bottom and rapidly shoot back up into a new bull market in 2020 (it is an even year). If that’s how it plays out, then now is the time to start thinking about the future. Start discussing taking some profits or set targets to take profits on downside hedges already in place. If you are an OEM or service center, perhaps look to 2020 and start an incremental buy program to fix a certain percentage of your steel cost at these historically attractive prices. Same goes for physical deals. Sun Tzu said, “a battle is won before it is fought.” 2019 has been a brutal year for you and me both. Now might be a good time to consider some sage advice by Bluto Blutarsky who said, “when the goin’ gets tough, tough get goin.” So, pick your head up, shake it off and look to take on some risk.
Here are some ideas on how:
1) Buy HRC futures. First half 2020 traded today at $530 while Calendar 2020 is somewhere in the $530-$535 area. Perhaps that price is still not attractive enough, so target a price that works. Maybe its $475 or $440, but whatever price is right for you, take Sun Tzu’s advice and set up a plan of attack now as the market might move down quickly and fire back up. I can promise you the market is not going to wait for you to hem and haw. Don’t be the one who says, “I would have made that trade.”
2) Buy a calendar spread in HRC futures. If the market bottoms, the curve will shift from contango (upward sloping) to backwardated (downward sloping). For instance, if you can buy January 2020 at $25-$30 below where you can sell May 2020, that could provide you with a nice opportunity to take a relatively safer position that will profit from a rally with limited downside. Keep in mind that this type of trade also comes with limited upside (relative to just going long futures). Figure $10-$15 per ton risk vs. a $60-$70 upside is a solid move.
CME Midwest HRC Futures Curve

Busheling is expected to settle down $50 this month to around $225. Last night, the November busheling scrap future settled $20 below the November LME Turkish scrap future.
2nd Month CME Busheling (white) & 2nd Month LME Turkish Scrap (red)
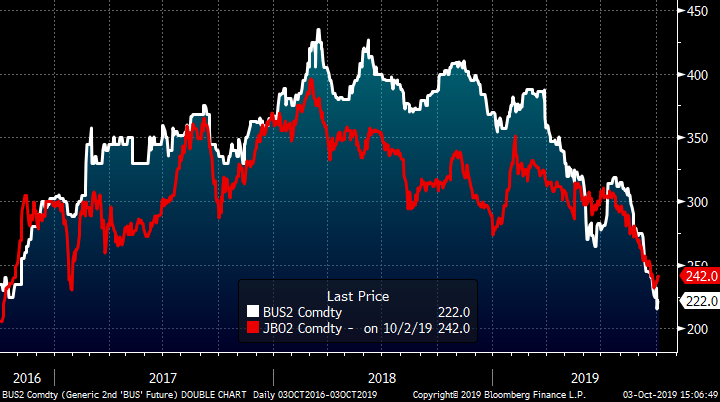
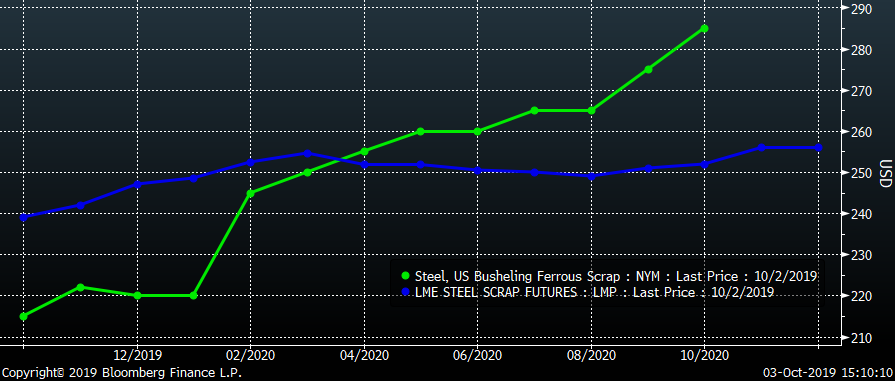
3) Buy busheling and sell LME Turkish scrap futures – If you can get it off, buying December and January busheling scrap futures at almost $30 below LME Turkish scrap is another no brainer as was recommended in June.
LME Turkish Scrap & CME Busheling Futures Curves
T. Boone Pickens passed away in September and left a final message to his followers on social media. In that message he said:
“Be willing to make decisions. That’s the most important quality in a good leader: Avoid the ready-aim-aim-aim-aim syndrome. You have to be willing to fire.”


