Prices

August 1, 2019
Hot Rolled Futures: Bear Market Rally Losing Steam and Approaching Resistance
Written by David Feldstein
The following article discussing the global ferrous derivatives markets was written by David Feldstein. As an independent steel market analyst, advisor and trader, we believe he provides insightful commentary and trading ideas to our readers. Note that Steel Market Update does not take any positions on HRC or scrap trading, and any recommendations made by David Feldstein are his opinions and not those of SMU. We recommend that anyone interested in trading steel futures enlist the help of a licensed broker or bank.
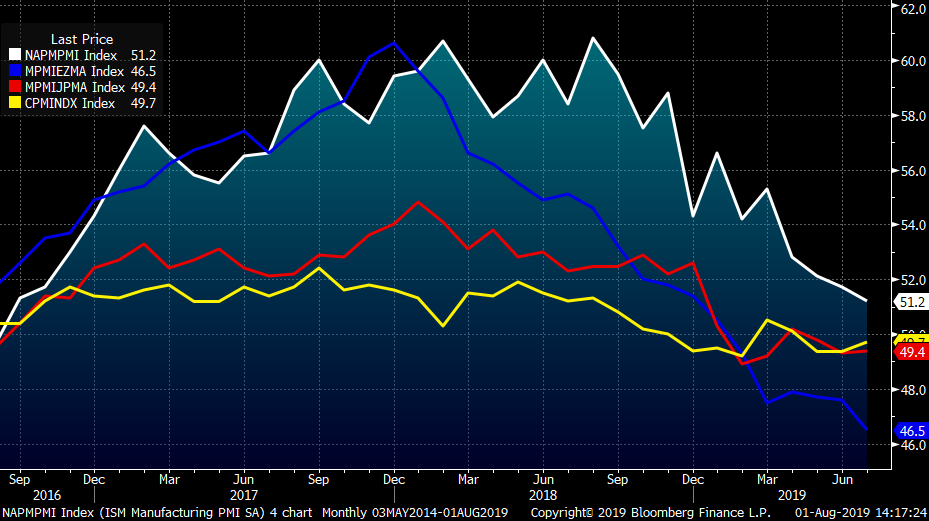
July manufacturing PMIs continued to be extremely depressed. Japan and China were slightly higher but remained below 50, indicating contraction. The Eurozone PMI continued lower to a very sickly 46.5. The ISM Manufacturing PMI fell 0.5 points to 51.2, remaining above 50 indicating growth, but at a drastically slower pace—the slowest since August 2016. The ISM new orders sub-index gained slightly to 50.8, but the backlog sub-index fell 4.3 points to a very dangerous 43.1.
July Manufacturing PMIs for U.S. ISM (white), Eurozone (Blue), Japan (red) and China (yellow)
After a brutal second quarter, Midwest flat rolled prices have rebounded significantly with the rally sparked by U.S. Steel’s supply curtailment announcement followed subsequently by numerous mill price increase announcements.
Rolling 2nd Month CME Midwest HRC Future
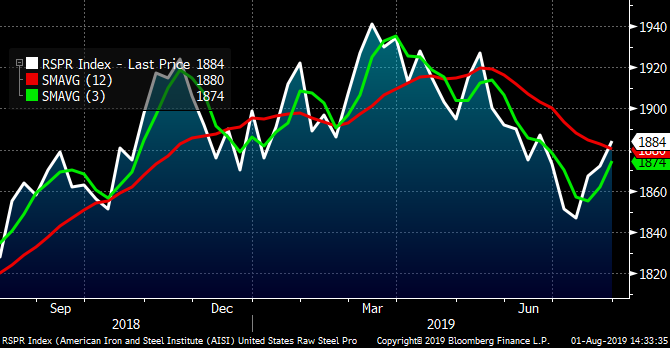
AISI crude steel production data started to decline in the second quarter before hitting its lowest level in almost a year in mid-July, but has since rebounded. Recently, this has been a very reliable indicator of Midwest flat rolled prices.
AISI U.S. Crude Steel Production
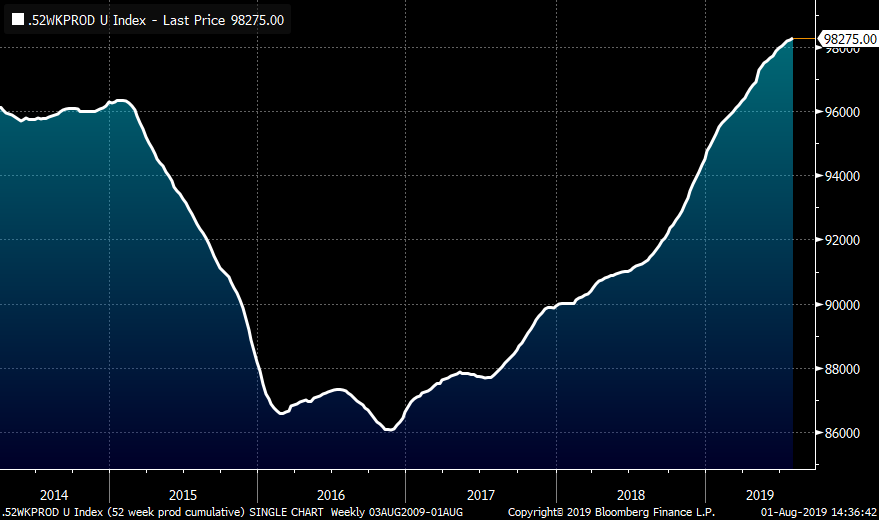
This chart is a moving sum of 52 weeks of weekly steel production. The 52-week sum continues to make new highs indicating zero resolution to the oversupplied market. Based on this data, the outlook for pricing is bleak.
AISI U.S. Crude Steel Production 52-Week Sum
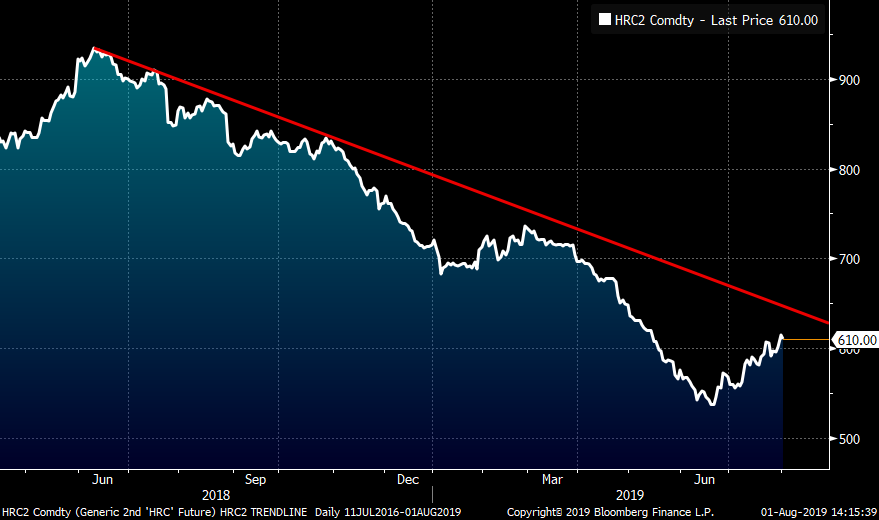
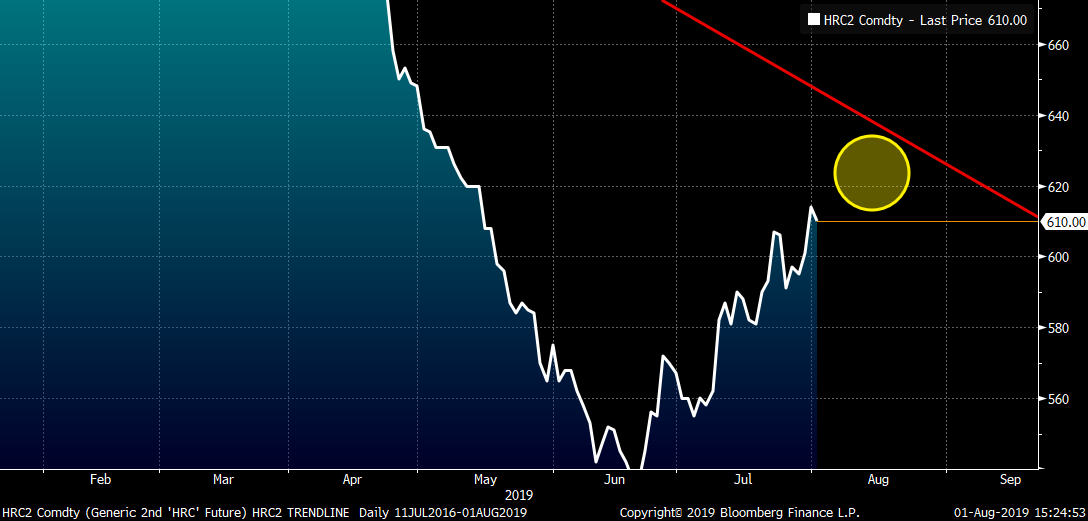
Domestic flat rolled remains in a bear market (see April 11 SMU for more about this topic). The chart below zooms in on the rolling 2nd month CME Midwest HRC future as prices approach this long downtrend line. This is definitely a tricky area. If prices break above the downtrend with authority, this could be an indication that the bear market is over. Throughout this move lower, decreased net imports have been eclipsed by the oversupplied Midwest market and slowing manufacturing growth.
Keep doing what’s been working until it stops working. “Get back in there and sell, sell, sell!!!” targeting the yellow area in the chart below ($615 to $635 or better). If you are long steel, it’s time to start working on your hedge for the balance of 2019, ideally targeting sale in the months of October through January. Barring material curtailment to supply, whether planned or unplanned, it looks all but certain that a test of the price low made in June is coming.
Rolling 2nd Month CME Midwest HRC Future
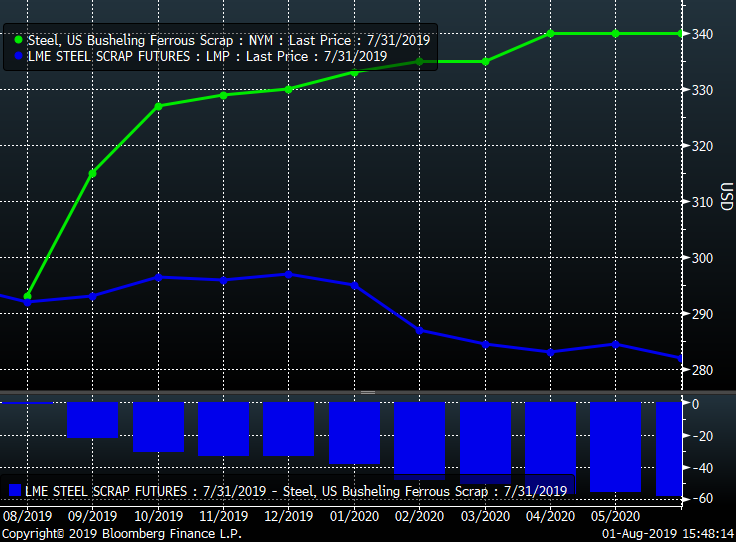
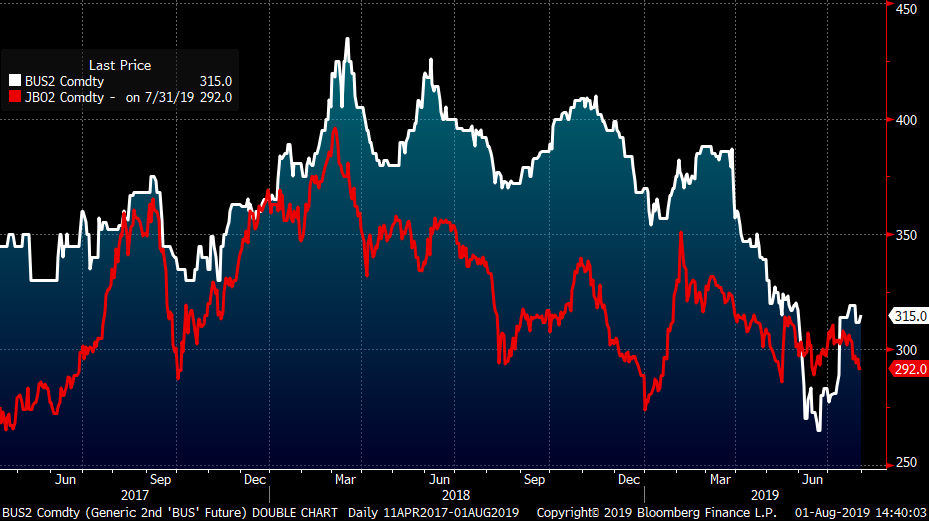
The rally in Midwest HRC carried busheling higher with September settling last night at $315/lt. September LME Turkish scrap moved lower in the past few days settling last night at $293/mt. Both remain in a bear market as well.
2nd Month LME Turkish Scrap (green) & 2nd Month CME Busheling Futures (white)
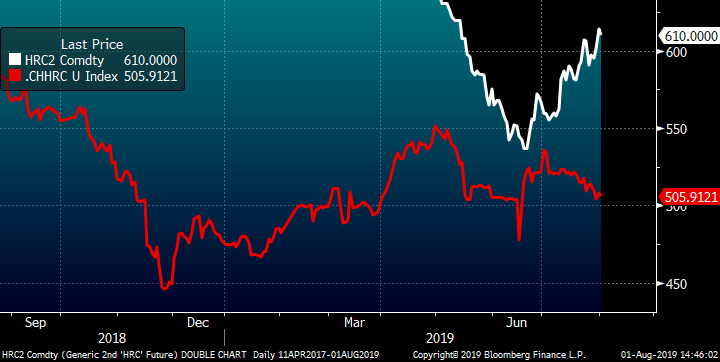
The rally in the 2nd month Midwest HRC future has opened up the premium over the Chinese 2nd month HRC future now above $100 and this differential increases in future months.
September CME Midwest HRC future $/st vs. Shanghai Futures Exchange Chinese HRC Future $/st
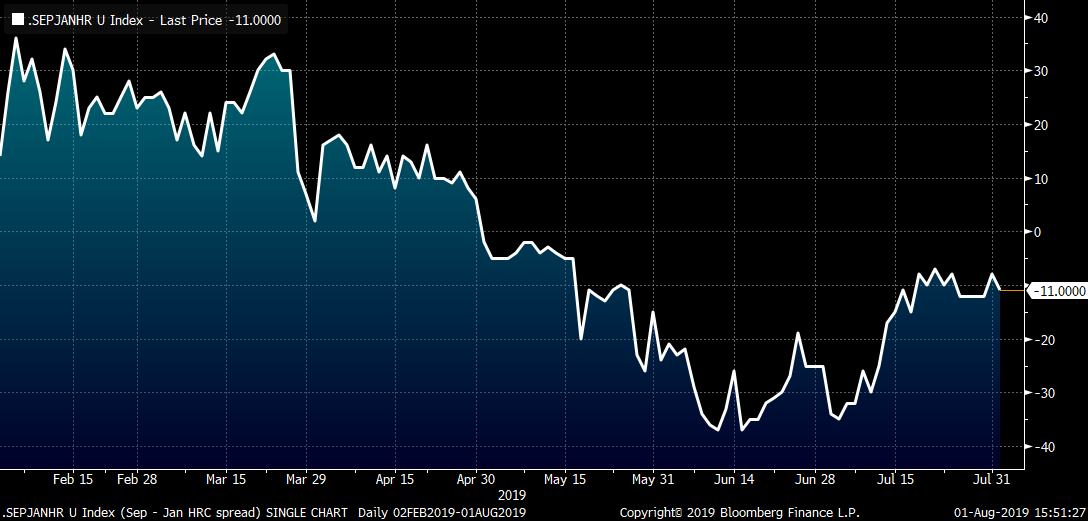
Let’s check in on the trade recommendations made in June one last time. This chart shows the September 2019 minus January 2020 spread trade. This trade has shown a profit of approximately $20-$25 so far. Considering the sell recommendation above, taking a profit and exiting this trade looks like a prudent move. An alternative move would be selling the September future, thus taking a gain of $40-$50/st, while keeping the January short position on as a hedge against inventory or incoming physical HRC.
September 2019 Minus January 2020 CME Midwest HRC Future Spread
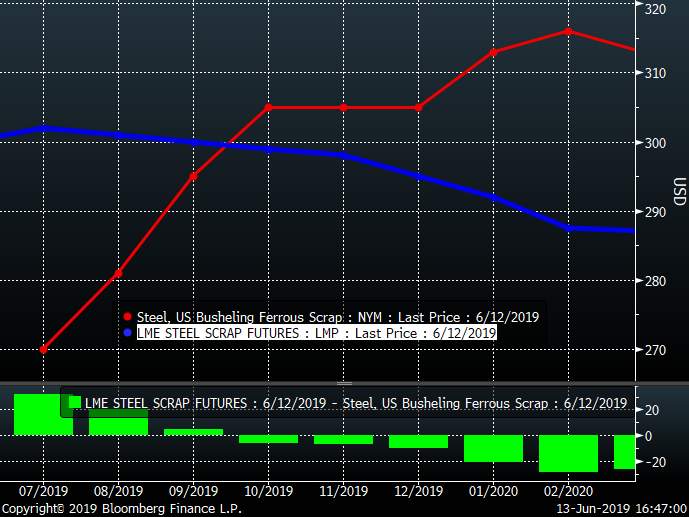
Another recommendation in that June article was: Buying Q4 busheling at $5 over Q4 Turkish scrap is a no brainer in and of itself, but also a fantastic trade to mitigate upside price risk in Midwest HRC.
This chart shows both curves on June 13:
LME Turkish Scrap & CME Busheling Futures Curves
This chart shows the curves as of last night. Regardless in what month(s) the spread trade was executed, it showed a decent profit so far, and taking the profit on these trades looks to be a decent call as well. No one ever went broke taking a profit.