Market Data

July 18, 2019
Currency Update for Steel Trading Nations
Written by Peter Wright
In this report, we examine the change in currency values of the 16 preeminent global steel and iron ore trading nations. The currencies of these 16 don’t necessarily follow the Broad Index value of the U.S. dollar. In fact, at any given time, some are always moving in the opposite direction. The latest value of the Broad Index as published by the Federal Reserve was July 5. In three months prior to that date, the dollar had strengthened by 1.8 percent and had weakened by 0.5 percent in the previous 30 days.
![]()
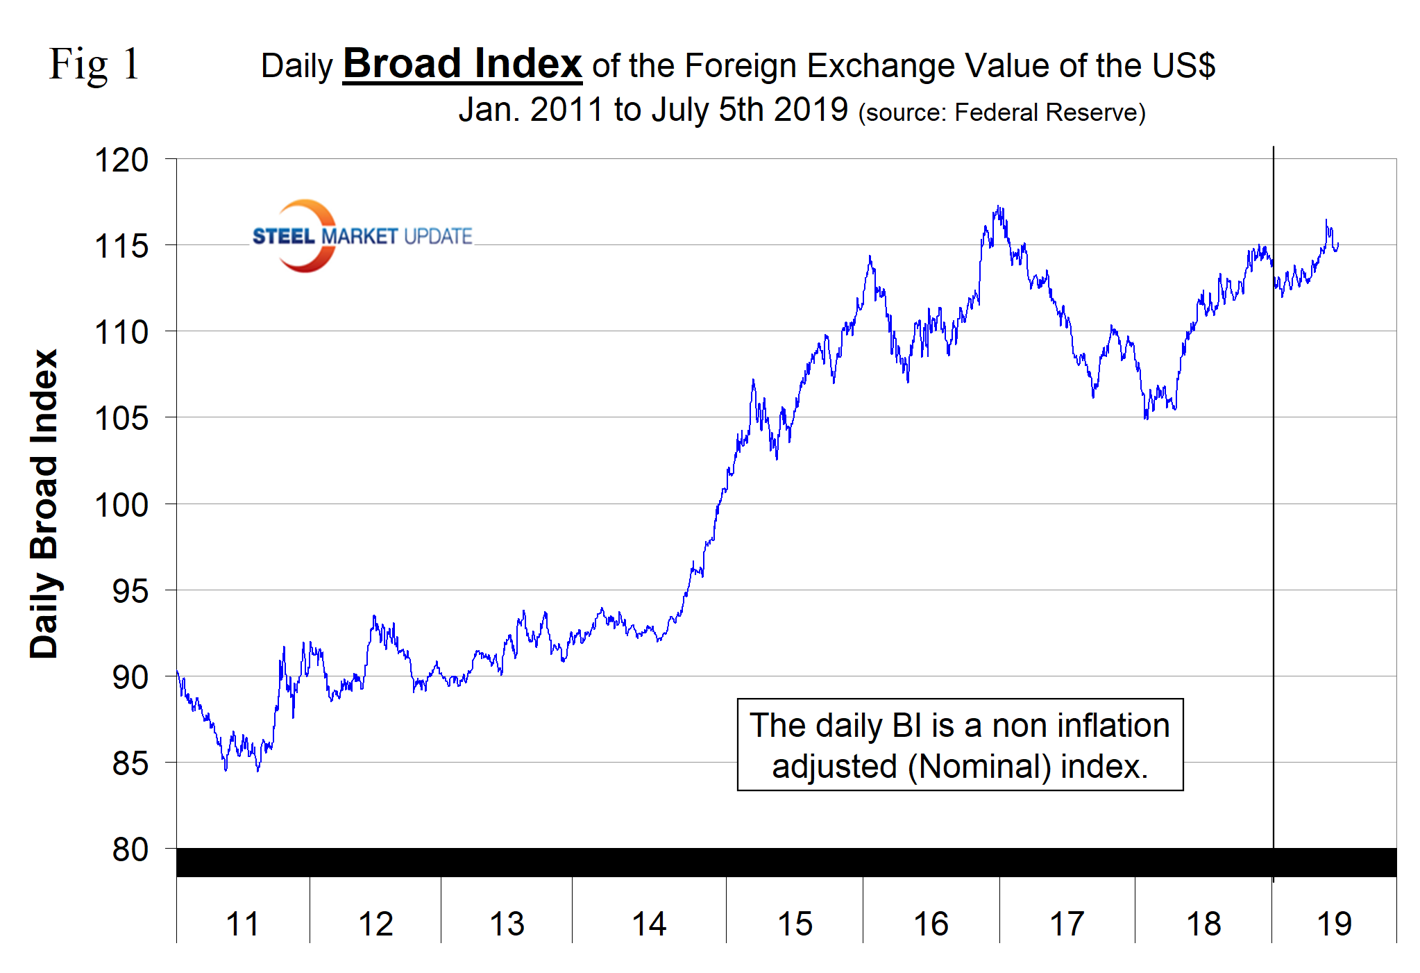
Figure 1 plots the daily Broad Index (BI) value of the U.S. dollar since 2011. The dollar declined in December 2018 and January 2019, recovered in the months February through May and declined in June through early July. The index has appreciated by 1.23 percent since Jan 1. The BI is still below its recent peak of December 2016.
Based on Fed Chairman Powell’s testimony before the U.S. Congress last week, a rate cut announcement at the July 30-31 FOMC meeting appears to be a done deal. On July 15, Andrew Hecht, a commodities analyst, wrote: “In 2018, the Fed under Chairman Jerome Powell increased the short-term Fed Funds rate by 25 basis points four times for a total of one full percentage point. Even though the Fed had guided that rates would rise three times, robust economic data caused the central bank to add a hike to its agenda, sending the Fed Funds rate to 2.25-2.50 percent. At the same time, the central bank continued its program of balance sheet normalization that reduced the debt securities and put upward pressure on interest rates further out along the yield curve. With European and Japanese interest rates in negative territory, the yield differentials between the dollar and other leading world currencies led to a rally in the dollar index. In the first sign that the Fed had gone too far in 2018, the central bank canceled all rate hikes for 2019 and cut the number of projected increases for 2020 in half to only one 25 basis point increase. The Fed also said that balance sheet normalization would end in September. At its June meeting, the members of the FOMC went even further as they told the market to expect interest cuts over the second half of 2019. The dollar is listening to the Fed Chairman, but at the same time, it is watching the robust economic data from the U.S. The dollar index has not moved much over the past weeks. After listening to Chairman Powell and watching the latest U.S. economic data, it is becoming clear that the Fed is preparing to make a corrective move in the Fed Funds rate, which is an admission that they went too far in 2018. The dollar index is likely to move lower in the aftermath of a rate cut later this month. However, while a 25 basis point move could cause a minor correction, a 50 basis point decline would be a different story.”
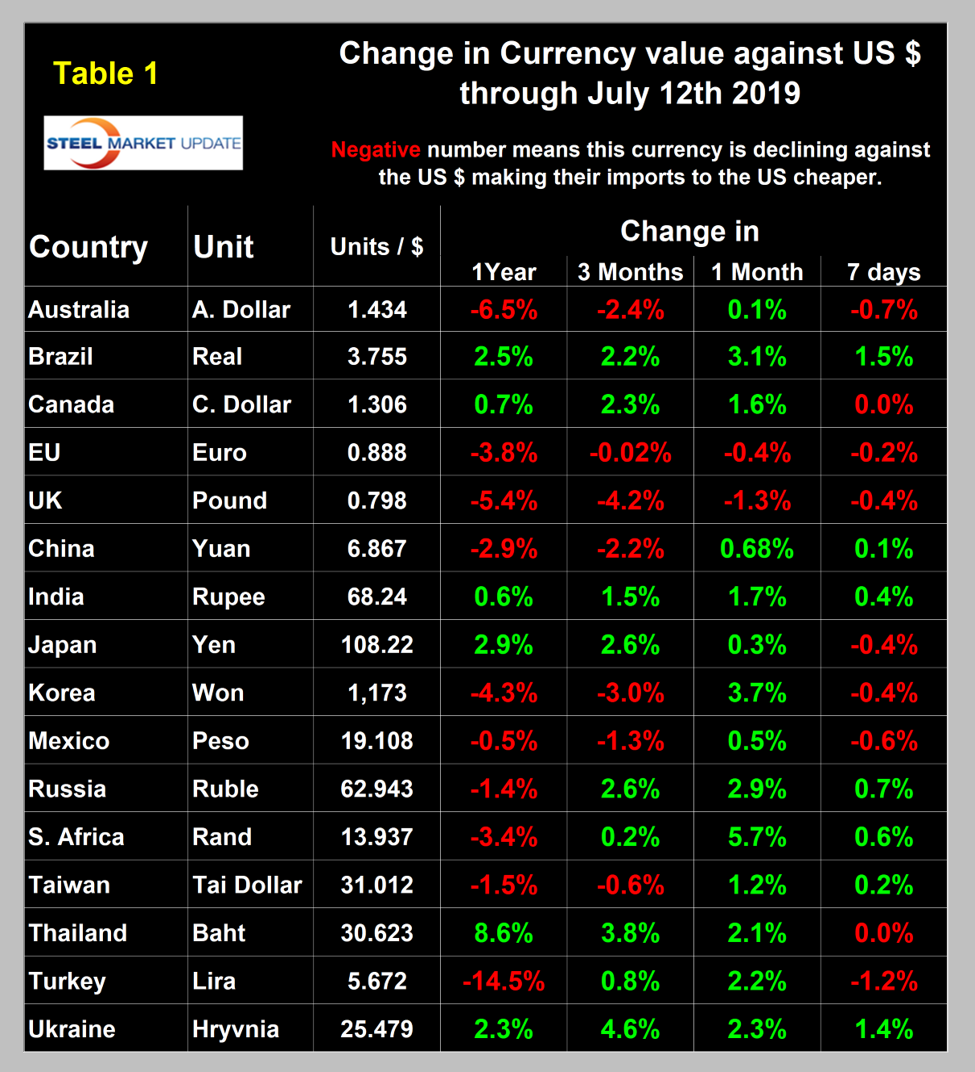
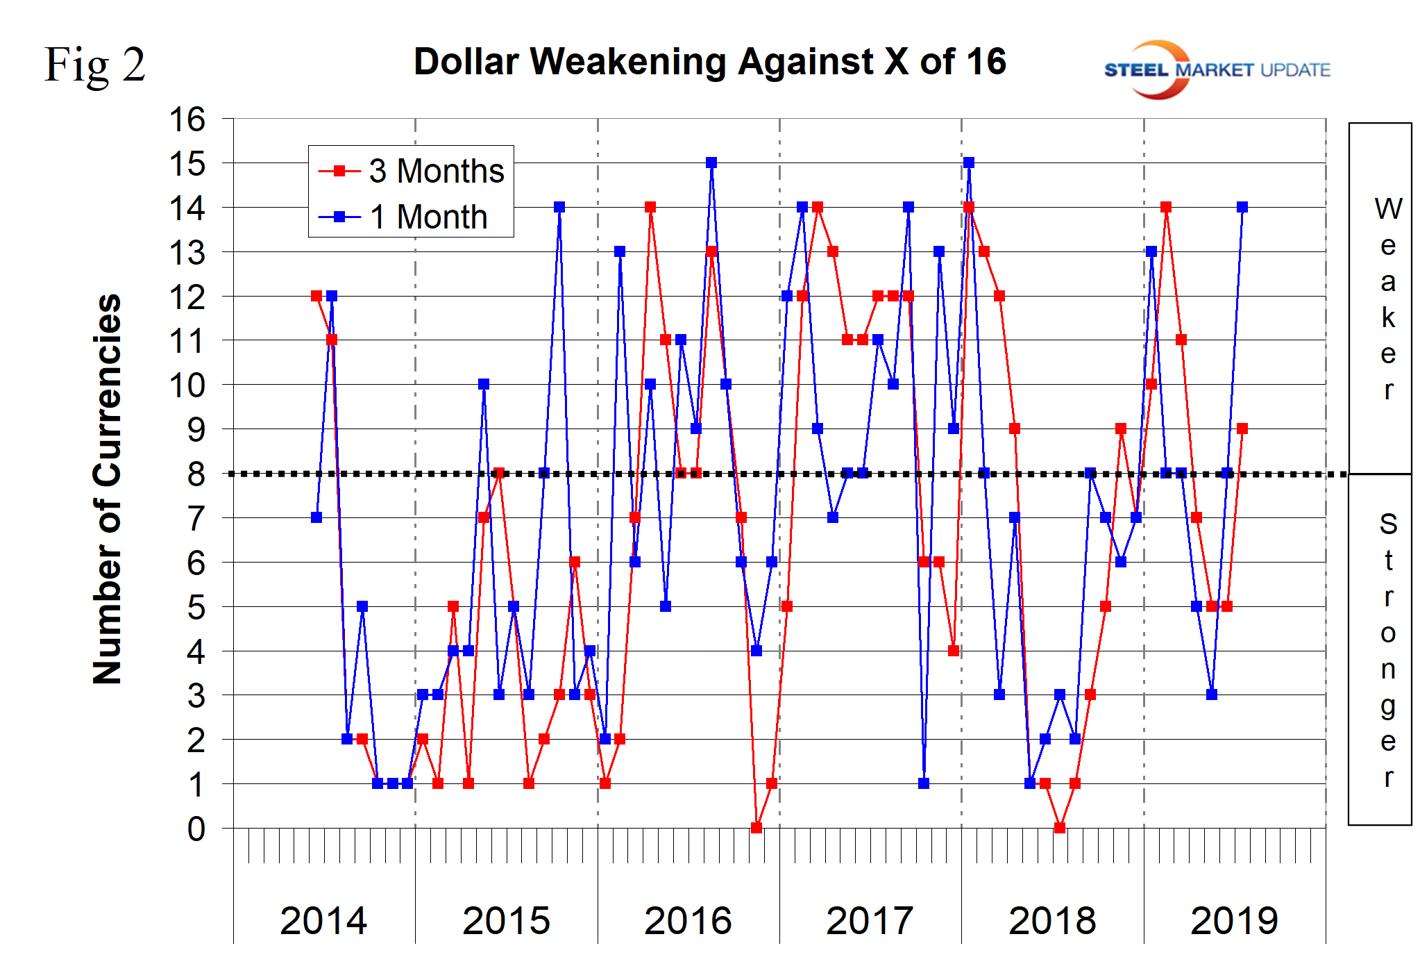
At Steel Market Update, we track the currencies of 16 steel trading nations. Table 1 shows the number of currency units that it takes to buy one U.S. dollar and the percentage change in the last year, three months, one month and seven days. The overall picture for the steel trading nations is that in the last year the U.S. dollar has strengthened against 10 of the 16 and weakened against six. In the last three months, the dollar has strengthened against seven and weakened against nine. In the last month, the dollar has strengthened against two of the 16 and weakened against the other 14. Table 1 is color coded to indicate weakening of the dollar in green and strengthening in red. We regard strengthening of the U.S. dollar as negative and weakening as positive because of the effect on net imports. Figure 2 shows the extreme gyrations that have occurred at the three-month and one-month levels since the beginning of last year.
Brazil’s Real
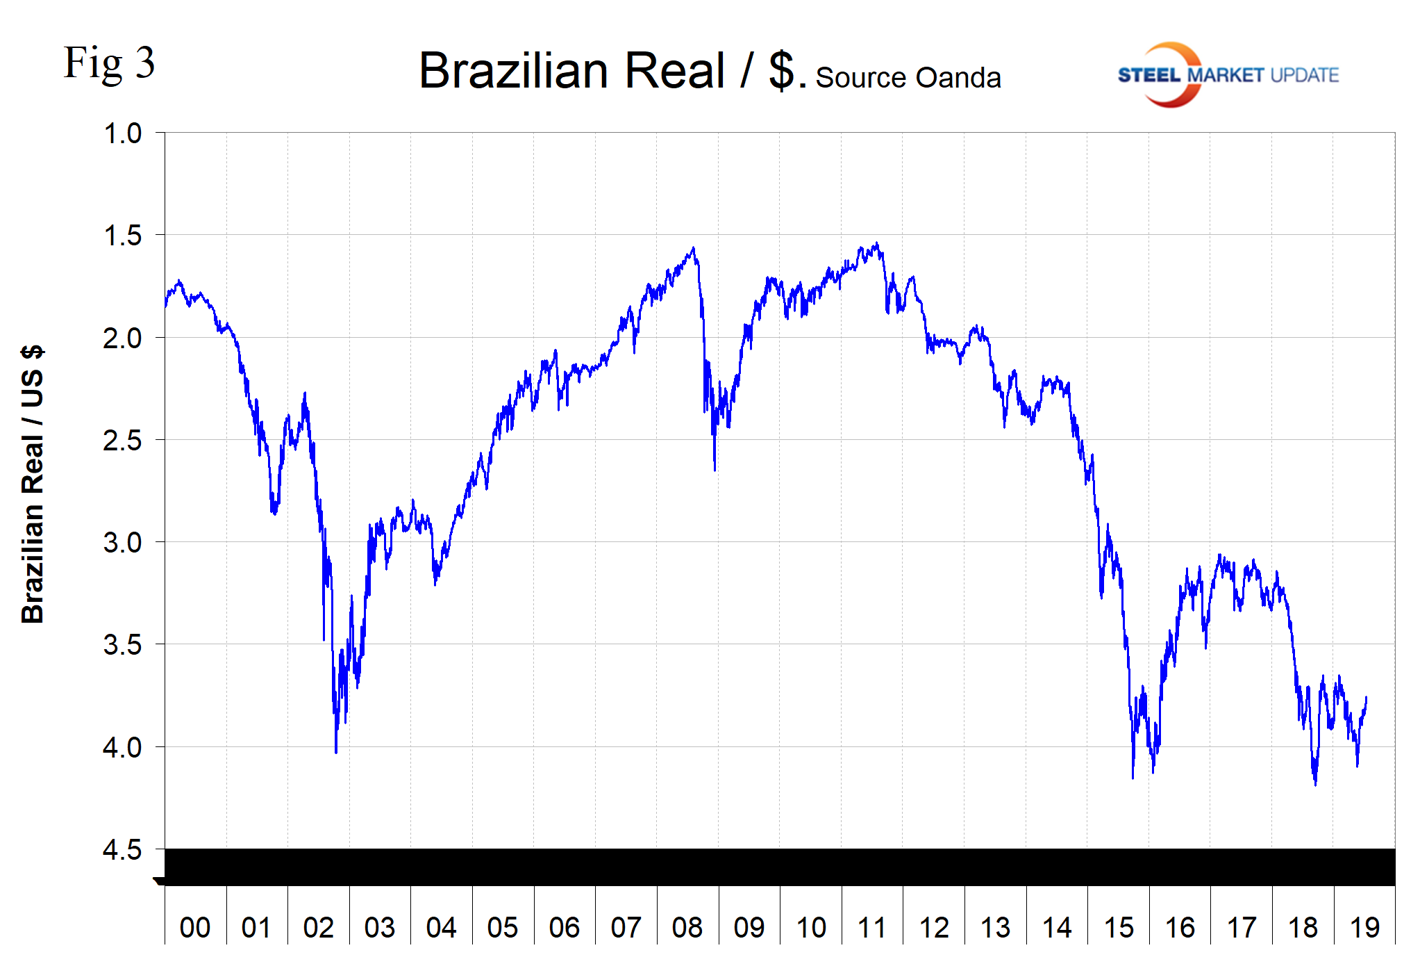
There haven’t been any major swings in currency value in the last three months (Figure 3). The Brazilian real and the Russian ruble have performed well in the short term and the Chinese yuan has declined by 2.2 percent in the last three months. (See the end of this report for details of data sources.)
The Brazilian real has appreciated by 3.1 percent against the U.S. dollar in the last month. On July 7, a currency analyst with the pseudonym Discount Fountain wrote: “The Brazilian real has performed strongly in 2019, outperformed only by the Japanese yen in terms of its rise against the greenback. While low economic growth in Brazil is a risk factor, I take a bullish view on the real. Brazil is one of the few emerging economies that is offering a significantly higher interest rate, while also keeping inflation at a relatively lower level. In this regard, I see a case for further upside in the real, particularly if we see quantitative easing continue in Europe and the United States – the indications being that this will be the case.”
Russia’s Ruble
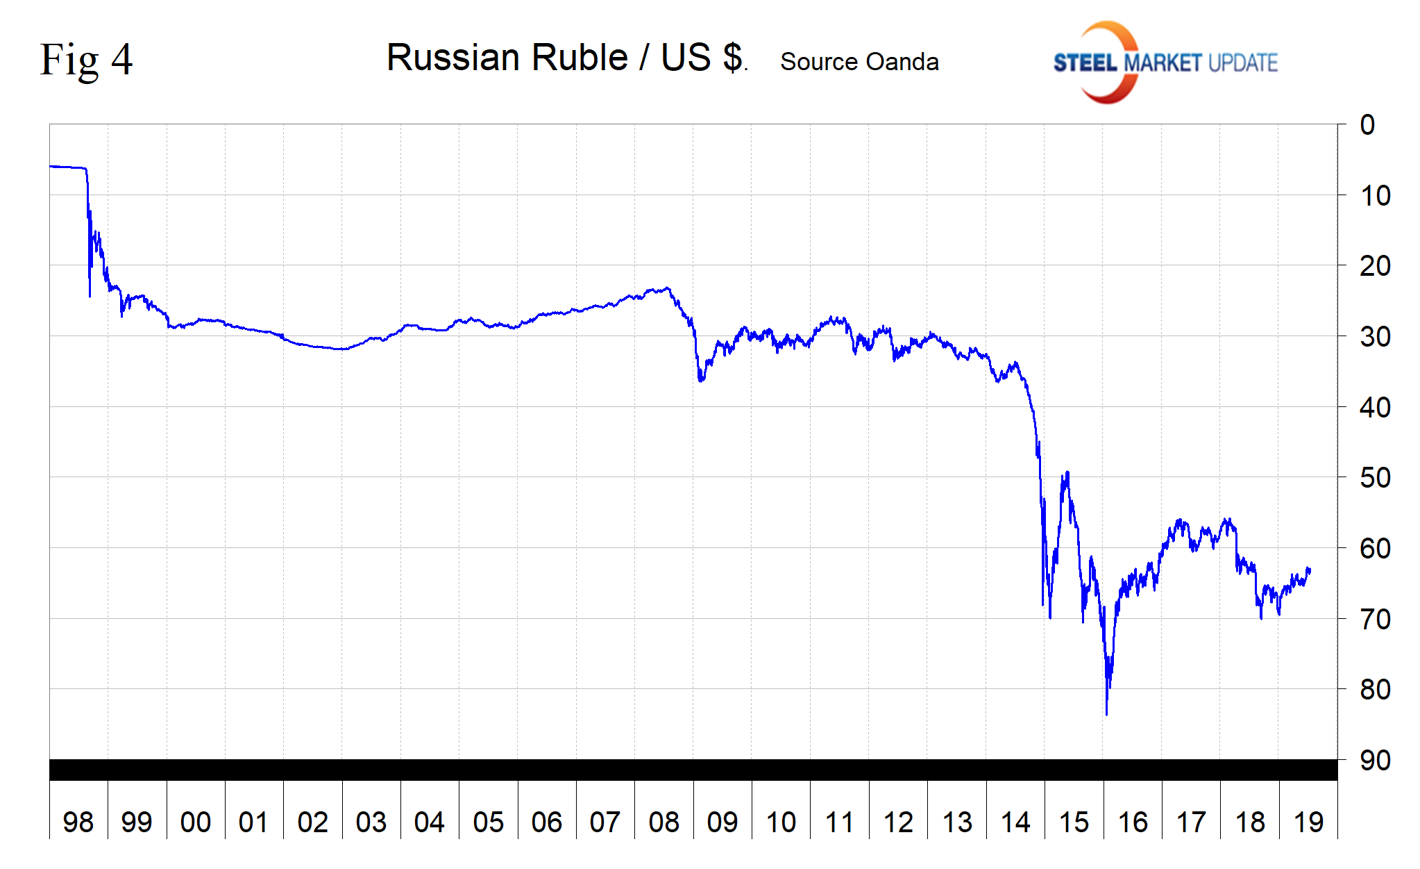
The Russian ruble has appreciated by 2.9 percent against the U.S. dollar in the last month. One dollar is now worth 62.94 rubles. The ruble has appreciated steadily throughout 2019 (Figure 4).
China’s Yuan
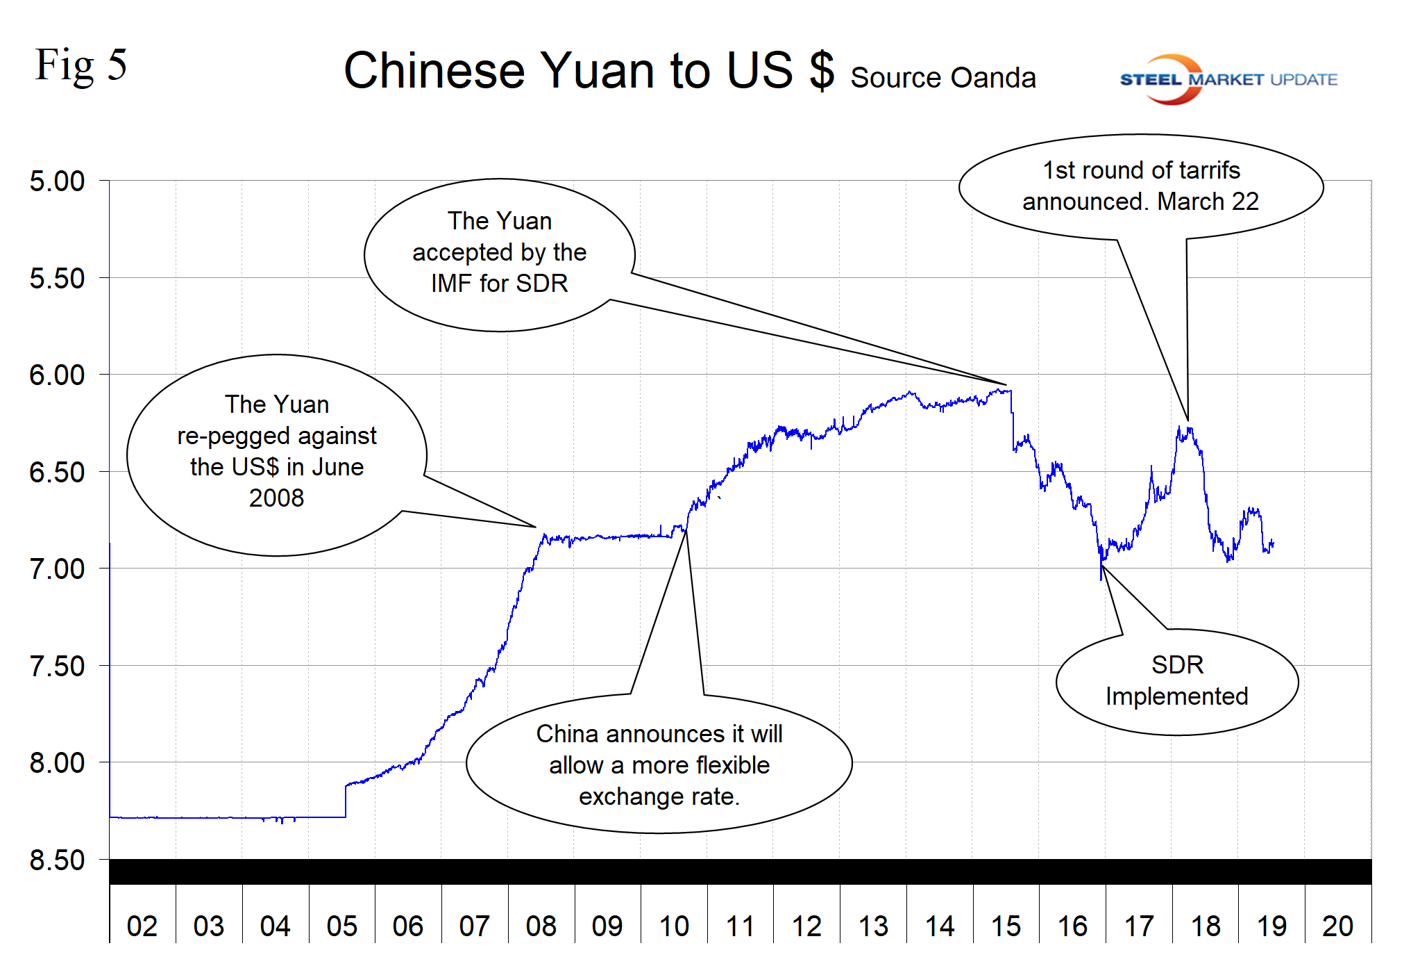
The Chinese yuan has declined by 2.9 percent in 12 months, of which 2.2 percent occurred in the last three months. There has been a recovery of 0.7 percent in the last month (Figure 5). On July 12, the U.S. dollar was worth 6.867 yuan.
In this monthly analysis, we show the trends we think have the most immediate significance, but all 16 steel trading nation graphs are available on request.
Explanation of data sources: The Broad Index is published by the Federal Reserve on both a daily and monthly basis. It is a weighted average of the foreign exchange values of the U.S. dollar against the currencies of a large group of major U.S. trading partners. The index weights, which change over time, are derived from U.S. export shares and from U.S. and foreign import shares. The data are noon buying rates in New York for cable transfers payable in the listed currencies. At SMU we use the historical exchange rates published in the Oanda Forex trading platform to track the currency value of the U.S. dollar against that of 16 steel trading nations. Oanda operates within the guidelines of six major regulatory authorities around the world and provides access to over 70 currency pairs. Approximately $4 trillion U.S. dollars are traded every day on foreign exchange markets.


