Prices

July 11, 2019
HRC Futures: The Squeeze is On!
Written by David Feldstein
The following article discussing the global ferrous derivatives markets was written by David Feldstein. As an independent steel market analyst, advisor and trader, we believe he provides insightful commentary and trading ideas to our readers. Note that Steel Market Update does not take any positions on HRC or scrap trading, and any recommendations made by David Feldstein are his opinions and not those of SMU. We recommend that anyone interested in trading steel futures enlist the help of a licensed broker or bank.
The latest manufacturing data was dreadful. The chart below of the manufacturing PMIs of the U.S., Eurozone, Japan and China shows this continued downtrend with three of the world’s four largest economies in contraction. Further, in North America, the PMIs of Canada and Mexico are also in contraction territory.
Manufacturing PMIs for U.S. (white), Eurozone (blue), Japan (red) and China (yellow)
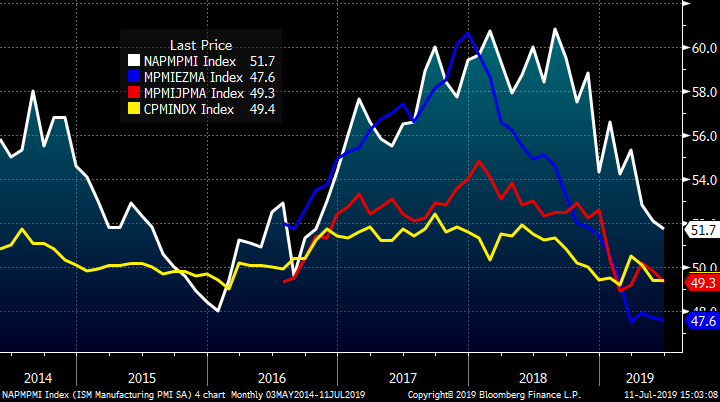
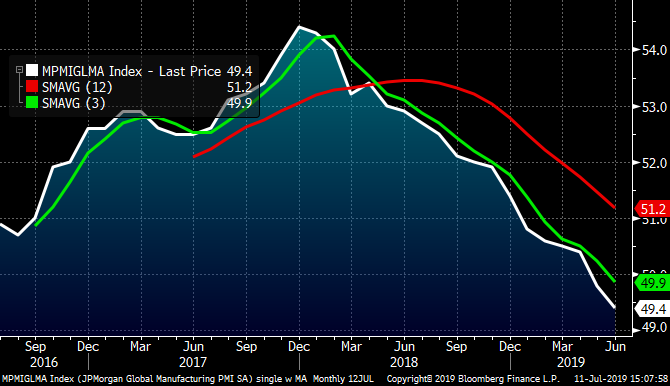
The J.P. Morgan Manufacturing PMI fell to 49.4 for its second consecutive month in contraction. The thing about this downright awful data is it forces action. The ECB joined many other global central banks already easing rates and providing economic stimulus while U.S. Federal Reserve Chairman Jerome Powell signaled this week that the Fed will cut rates at its next policy meeting.
J.P. Morgan Global Manufacturing PMI
In my last article on June 13, I wrote:
“As flat rolled prices and steel mill equity prices continue to plummet, an announced outage becomes increasingly probable as well. This would spark quite the short squeeze as being bearish on HRC has become a crowded trade.”
I sure got lucky on that one as U.S. Steel announced it was shuttering two blast furnaces five days later. At that time, many of you were in New York at the Steel Success Strategies Conference debating whether this was enough to shore up pricing. This move was not in isolation. It can be argued mills aggressively dragged prices lower to find a price point that would induce large buyers to write purchase orders for significant tons. It will be interesting to see if there was in fact a build in SMU’s service center inventory data over the next couple months. It will not be surprising to see that inventory did in fact build out, which also helped lead times increase. Nucor’s price increase announcement quickly followed U.S. Steel’s curtailment, which motivated more purchasing. This week a second Nucor price increase was announced in an attempt to get prices back up to $600/st.
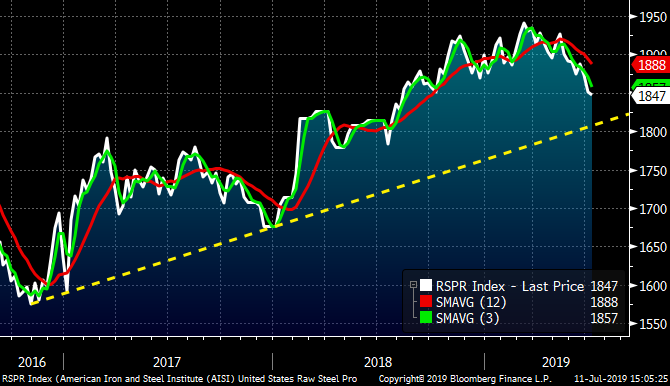
Also in that article, it was noted that the AISI Crude Steel Production level had begun to roll over and it has continued to trend lower since. Curtailing supply will be a critical factor in whether prices continue higher or retest the low.
Weekly AISI U.S. Crude Steel Production
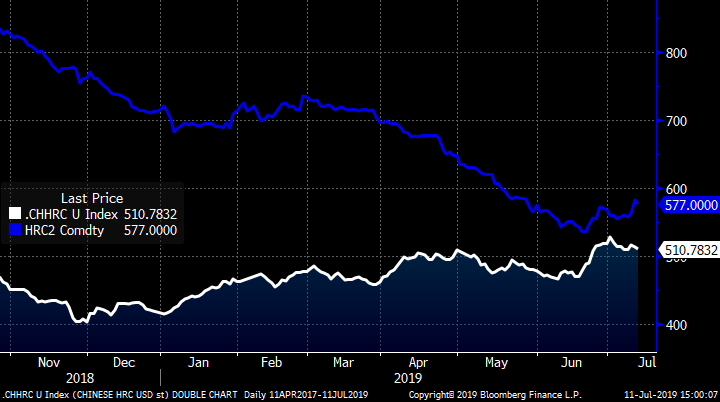
As the price of Midwest HRC fell, it closely approached the Chinese HRC price. The chart below shows the rolling 2nd month Chinese and Midwest HRC futures price both in USD per short ton. Using the Chinese HRC price as a proxy for global pricing, it can be expected that import orders over the past two months collapsed. Looking forward, a further drop in import tons will help the domestic price rally higher. In recent years, this has been an excellent indication of a significant rally to come.
SHFE Chinese HRC Future $/st vs. CME Midwest HRC Future $/st (both 2nd Month)
If imports in fact fall dramatically and domestic mills remain disciplined, then this rally could develop some serious momentum. That being said, Midwest HRC is still in a bear market and until it breaks above this trendline, a bear market it shall remain.
Rolling 2nd Month CME Midwest HRC Future
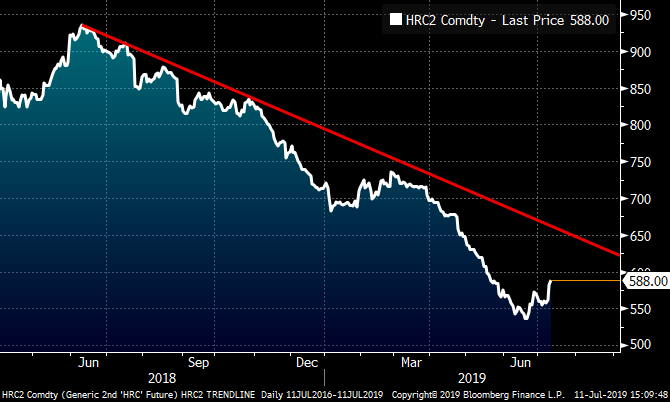
In a previous article, it was noted that a jump in volatility is a characteristic of a bear market; that volatility works not only on the downside, but also on the upside. In fact, some of the most significant volatility comes from the short squeeze rallies!!
“I would be real nervous holding speculative shorts at this point.” (6/13/19)
Continue to look for opportunities resulting from this spike in volatility. Unfortunately, the low hanging fruit has been picked. The next best opportunity looks to be targeting sales just below the trendline in the $630-$640 range, especially if you are hedging contract tons to be priced off a lagging index.
I am quite sure I will regret this at some point, but let’s take a look at how some of the trades recommended in the last article are faring.
“If you bought the September HRC future at $560 and sold the January HRC future at $600, you would collect a $40 convenience yield.”
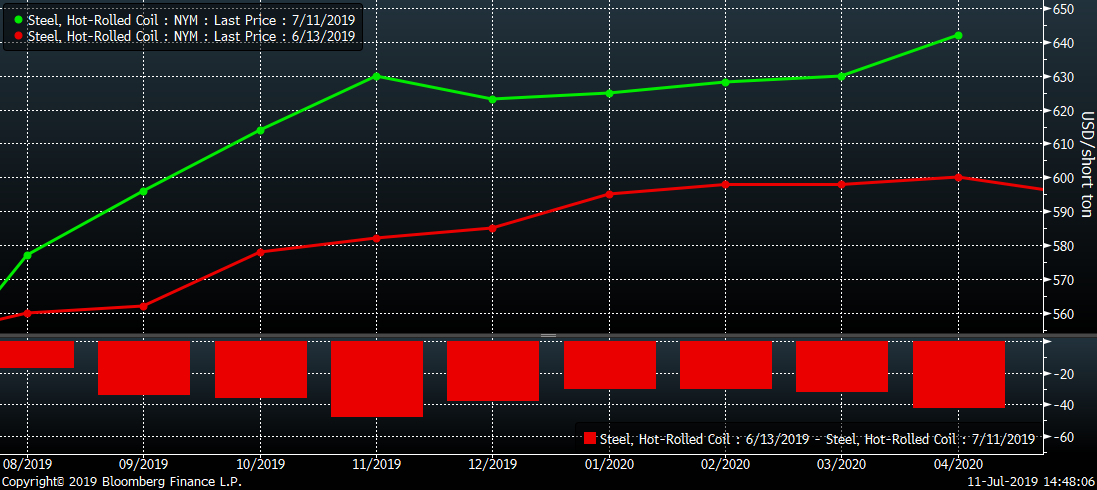
Since June 13, the Midwest HRC futures curve has rallied between $30-$45. The spread between September and January has compressed slightly to $25-$30, but if the rally continues, expect that to converge further with plenty of potential for September to trade above January. It will be interesting to see as well as September might trade up in to the $630-$640 area, while January sits. As discussed, these spread trades are relatively safer than buying the outright futures, but don’t offer as much upside and may take longer to develop.
Midwest HRC Futures Curve
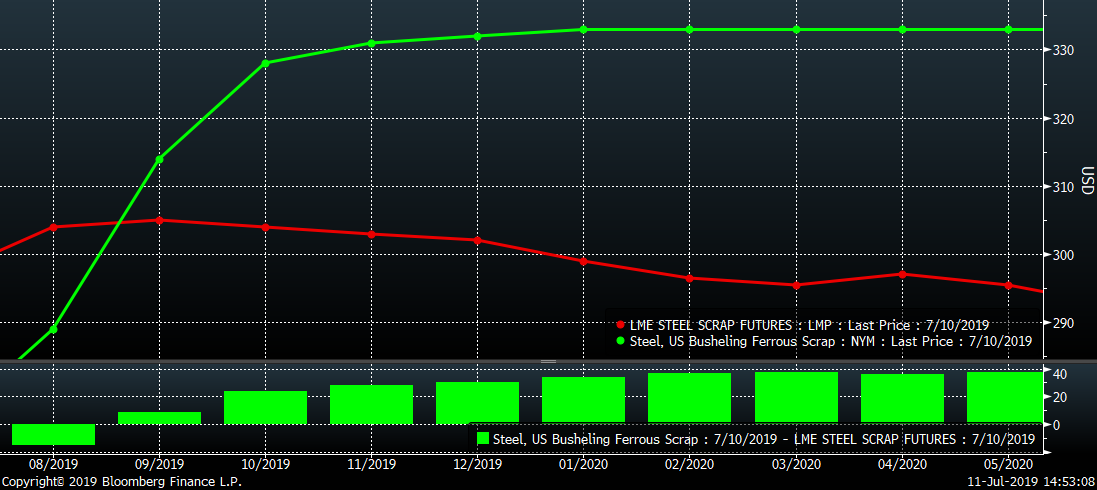
“Buying Q4 busheling at $5 over Q4 Turkish scrap is a no brainer in and of itself, but also a fantastic trade to mitigate upside price risk in Midwest HRC.” (6/13/19)
This trade may be one of my favorite trades I’ve ever seen and is now trading at $25-$30 vs. $5 less than a month ago.
LME Turkish Scrap & CME Busheling Futures Curve
So, what can you do going forward if you are long? Let the price rally and watch for extreme moves higher to sell into. Until prices break above that trendline, the market remains a bear market, and in a bear market selling the rally is the play.
If you’ve been short, I hope you had been buying in some of those shorts during the sell-off or even better loaded up when prices fell below $550. But if not, buy time and be patient as you might get another chance in the low $500s.
Stay risk-averse, my friends. Hold your cards close to the vest and keep your powder dry so you can be opportunistic for the next round of ferrous insanity.


