Market Data

June 21, 2019
Currency Update for Steel Trading Nations, June 16, 2019
Written by Peter Wright
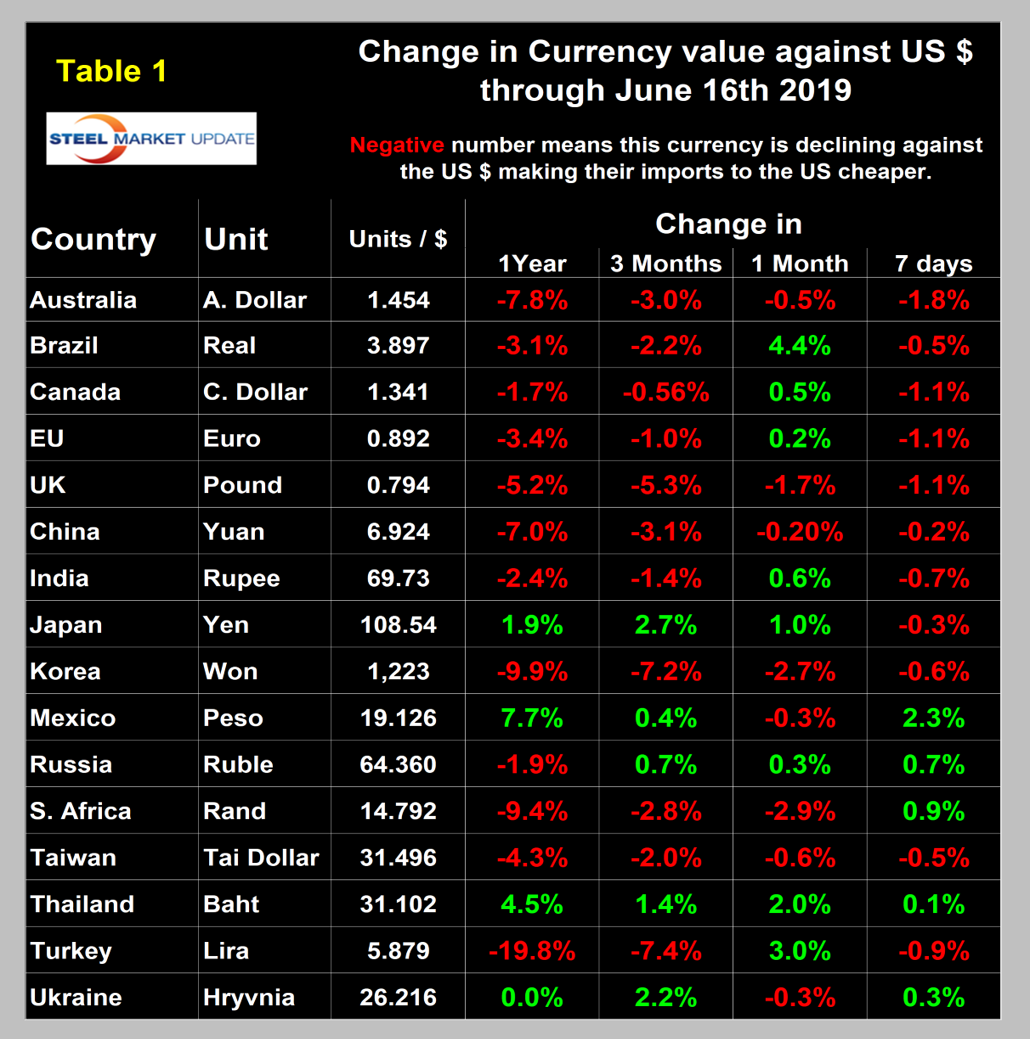
In this report, we examine the change in currency values of the 16 preeminent global steel trading and iron ore trading nations. The currencies of these 16 don’t necessarily follow the Broad Index value of the U.S. dollar. In fact, at any given time, some are always moving in the opposite direction. The latest value of the Broad Index as published by the Federal Reserve was June 14. In three months prior to that date, the dollar had strengthened by 0.7 percent and had weakened by 0.3 percent in the previous 30 days. Three currencies declined significantly in the last three months: the UK pound, the Korean Won and the Turkish lira. In this month’s update, we will examine the history of these three. (See the end of this report for details of data sources.)
![]()
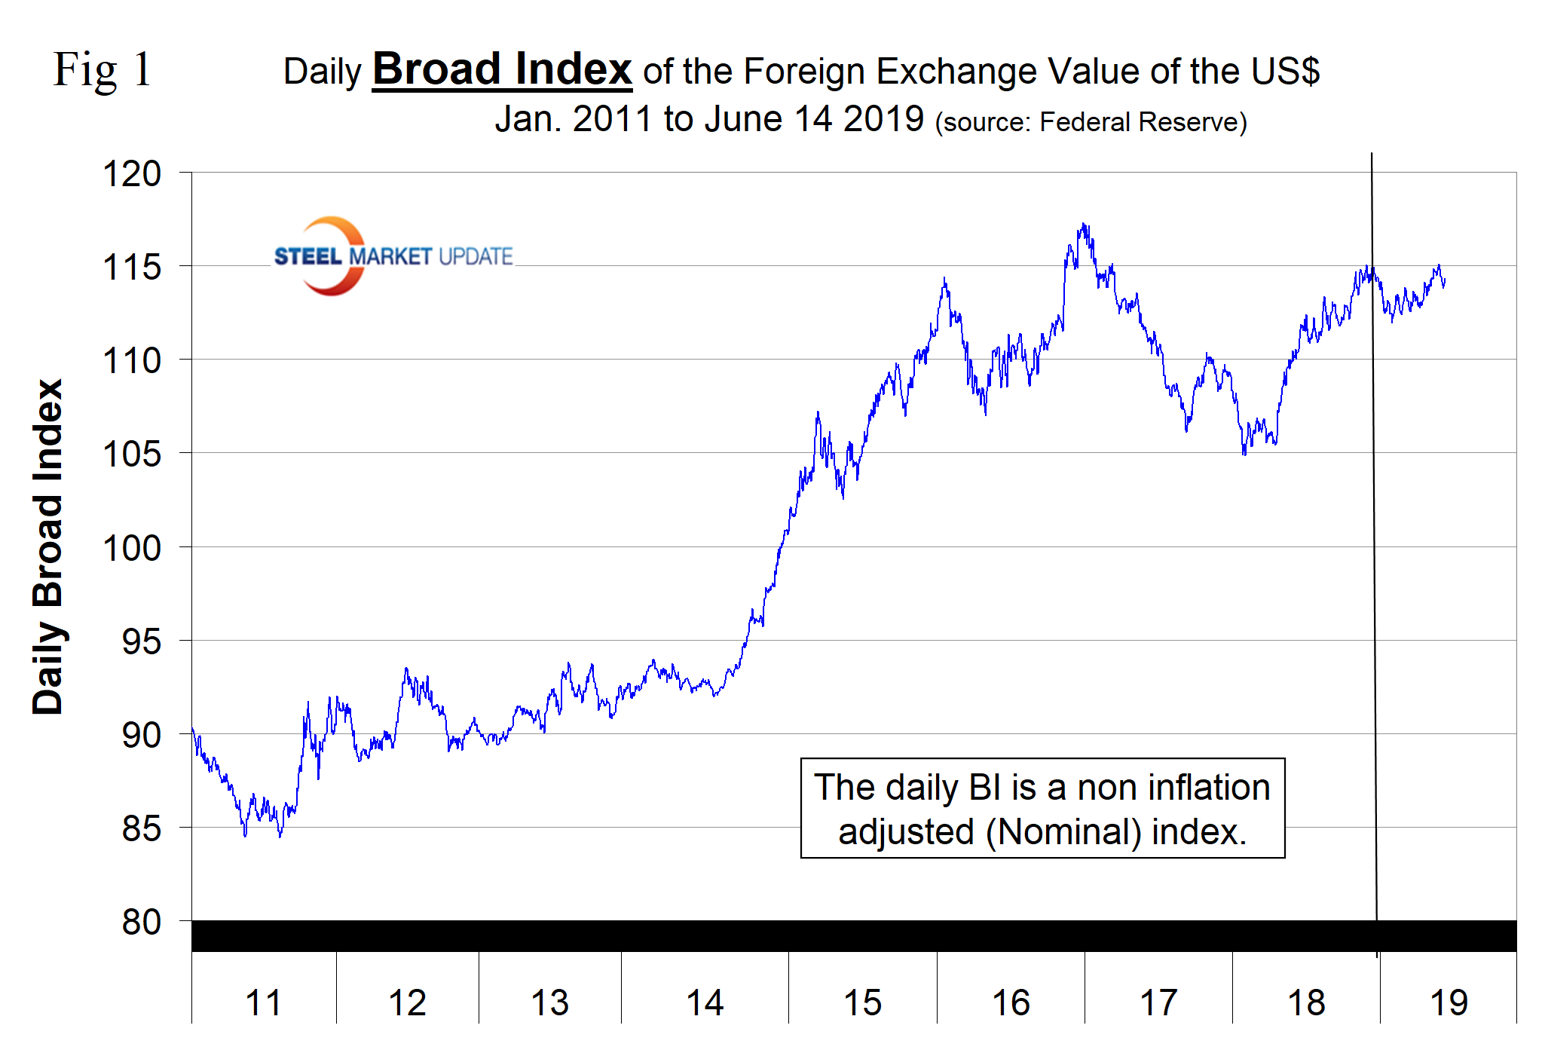
Figure 1 plots the daily Broad Index (BI) value of the U.S. dollar since 1995. The index has appreciated by 0.52 percent since Jan. 1 and by 0.7 percent in the last three months. The BI is still below its recent peak of December 2016.
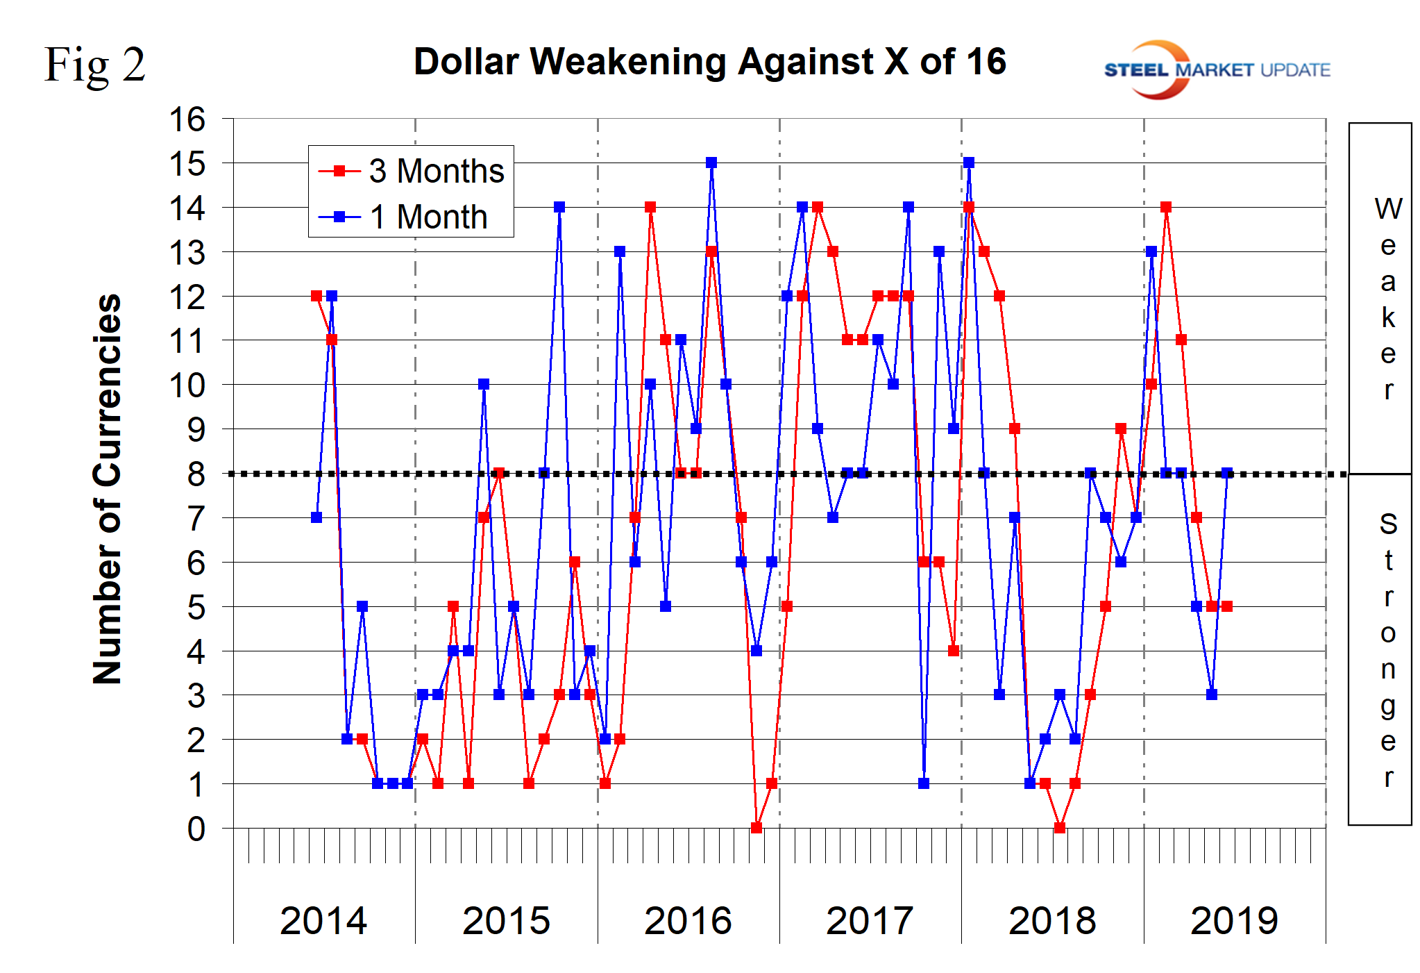
At SMU, we track the currencies of 16 steel trading nations. Table 1 shows the number of currency units that it takes to buy one U.S. dollar and the percentage change in the last year, three months, one month and seven days. The overall picture for the steel trading nations is that in the last year the U.S. dollar has strengthened against 11 of the 16 and weakened against four. In the last three months, the dollar has also strengthened against 11 and weakened against five. In the last month, the dollar has strengthened against eight of the 16 and weakened against the other eight. In the last seven days, it has strengthened against 11 of the 16. Table 1 is color coded to indicate weakening of the dollar in green and strengthening in red. We regard strengthening of the U.S. dollar as negative and weakening as positive because of the effect on net imports. Figure 2 shows the extreme gyrations that have occurred at the three- and one-month levels since the beginning of last year.
The Euro
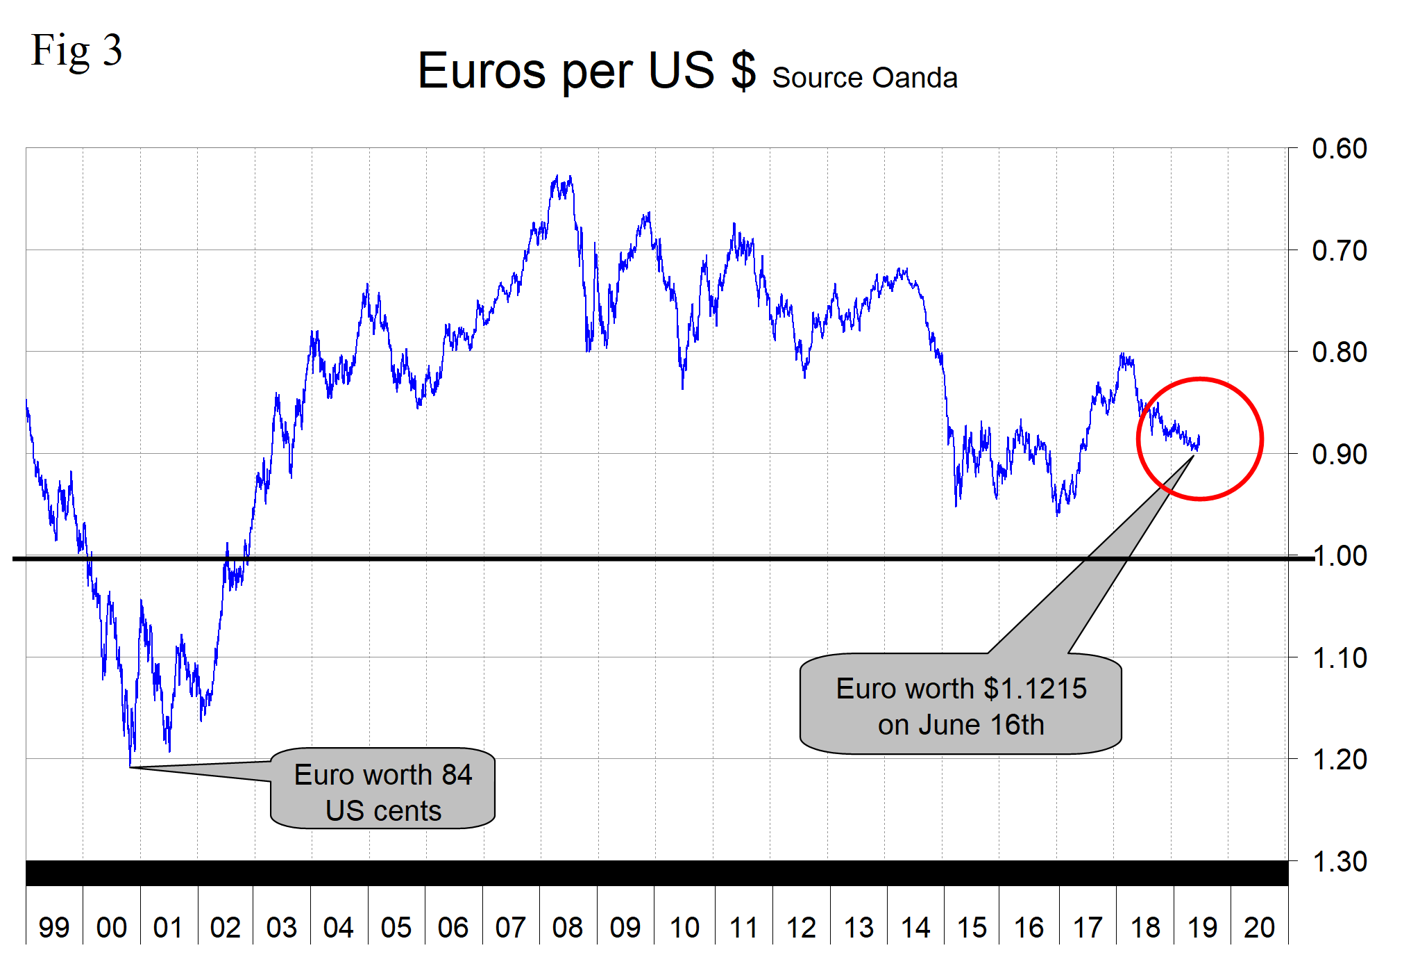
On June 13, the IMF staff’s concluding statement in the 2019 Article IV Mission read: “The euro area is at a challenging juncture. Growth is expected to firm up later this year, but there are significant risks to this outlook. Greater structural reform efforts at the national level would enhance the region’s resilience. In the event of a sharp downturn additional policy support will be needed. While there is some progress on euro area reforms, in many cases political consensus on the path forward is missing. The incoming European Parliament and European Commission should use the opportunity to forge a renewed consensus around strengthening the foundations of the monetary union.”
The euro has declined by 1.0 percent in the last three months and gained back 0.2 percent in the last month (Figure 3).
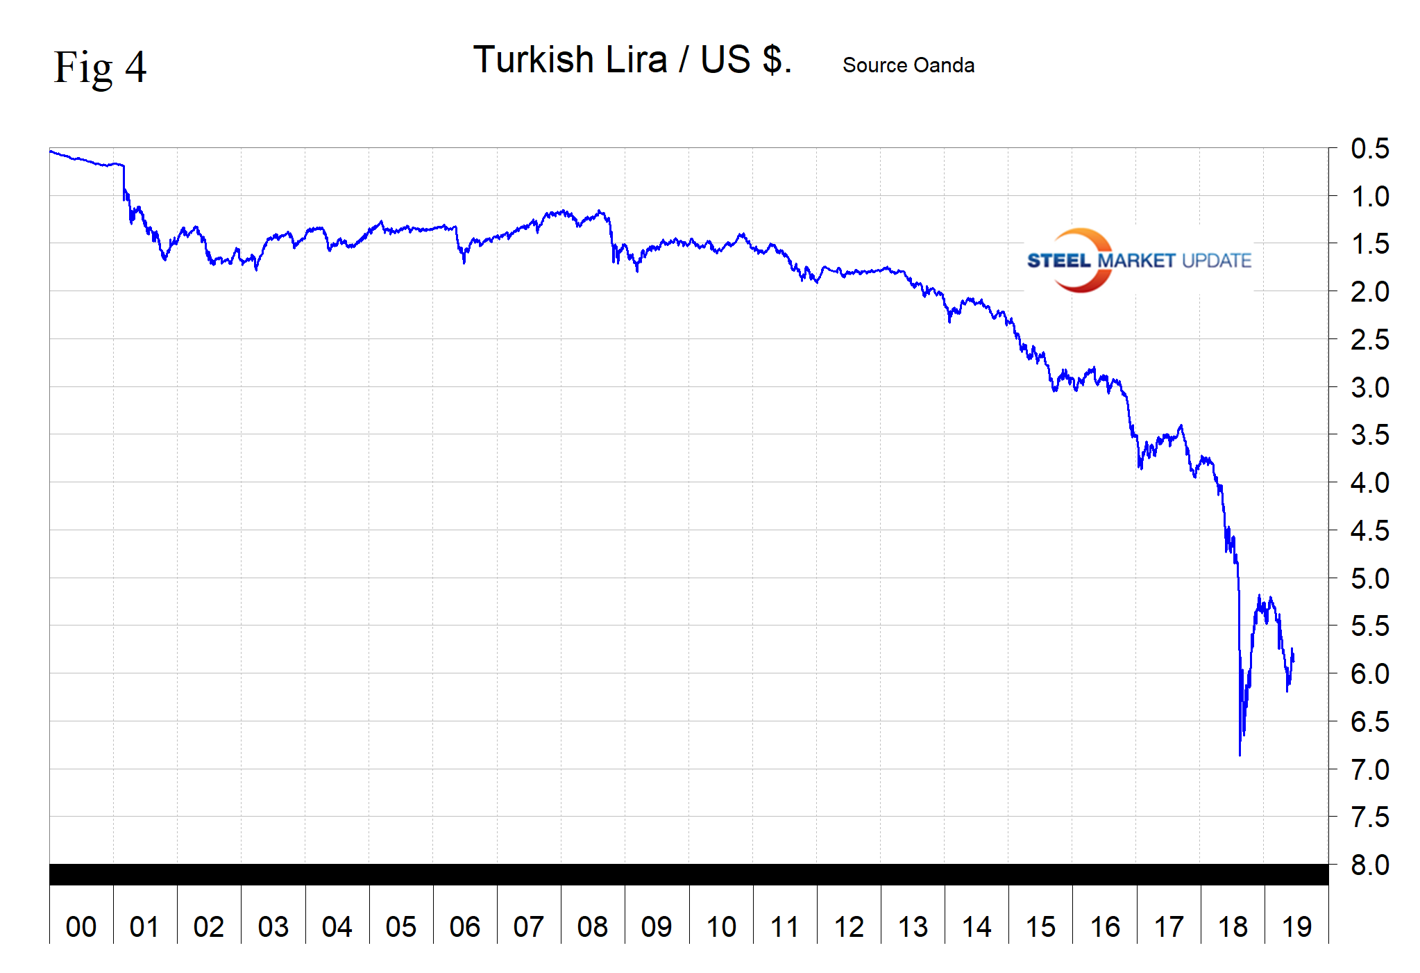
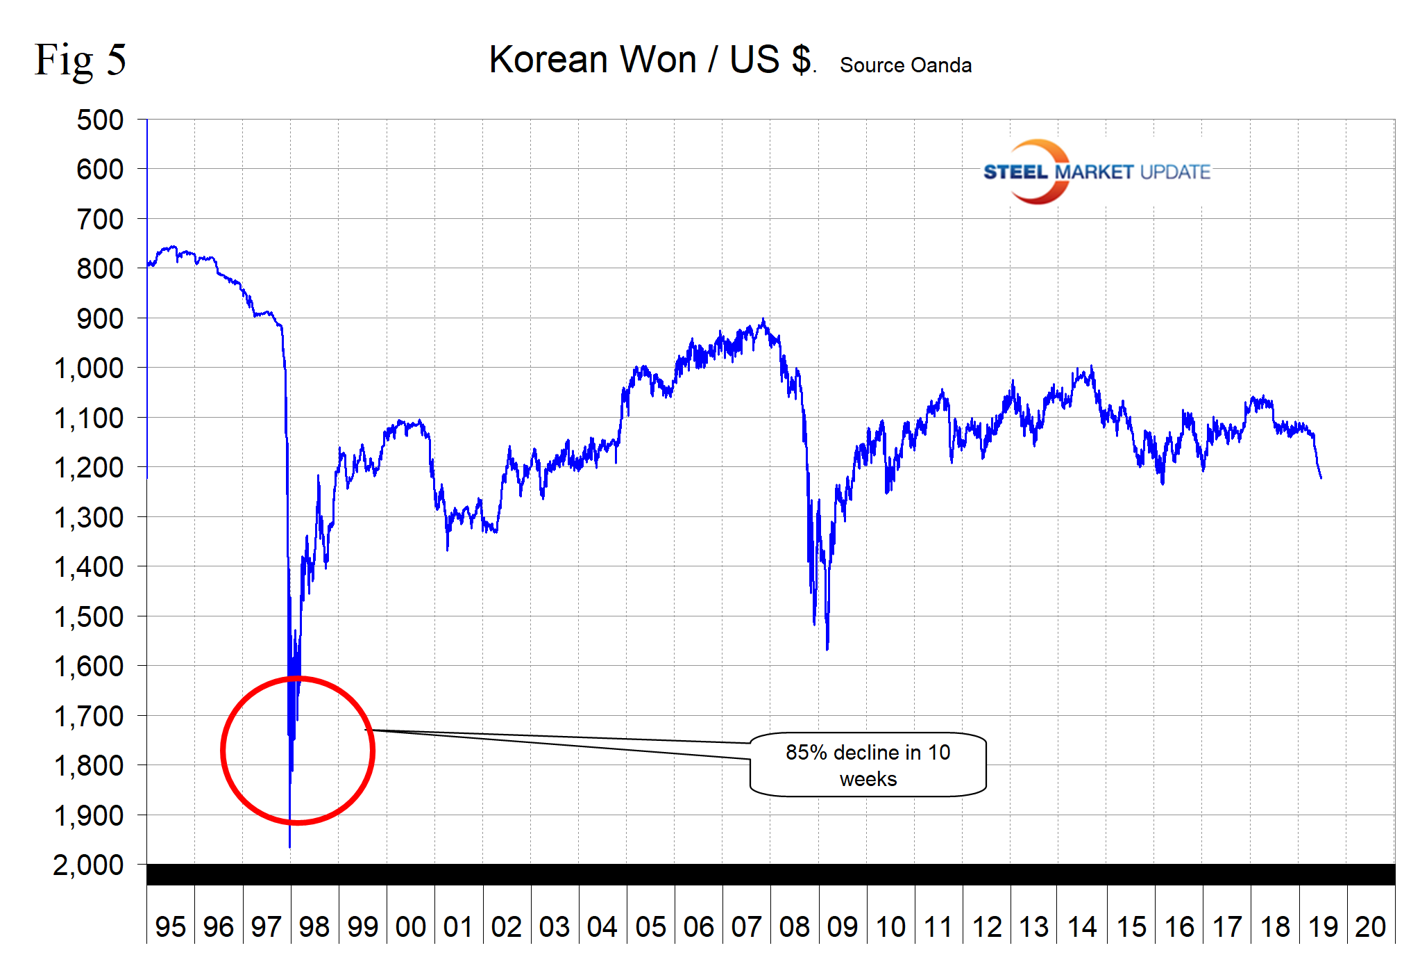
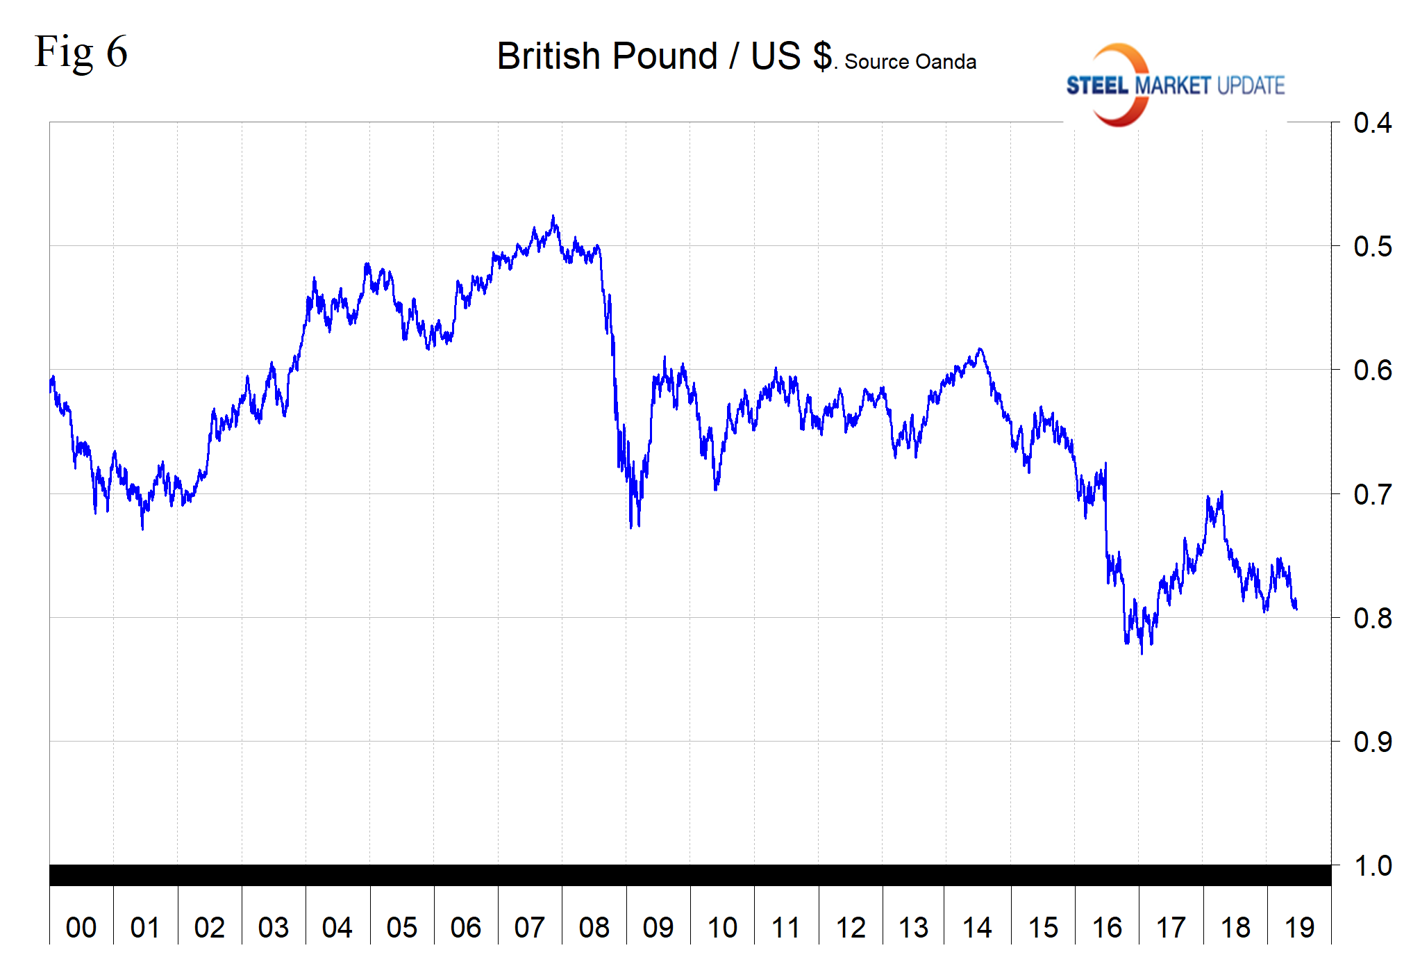
The following major changes have occurred in the last three months. The Turkish lira has declined by 7.4 percent. This follows the 12.8 percent decline that we reported last month. The lira is 19.8 percent weaker than this time last year. The Korean won has declined by 7.2 percent in three months and is down by 9.9 percent year over year. And the British pound has declined by 5.2 percent year over year. All of which has occurred in the last three months. Figures 4, 5 and 6 show the long-term trend of these three currencies.
In this monthly analysis, we show the trends we think have the most immediate significance, but all 16 steel trading nation graphs are available on request.
Explanation of Data Sources: The Broad Index is published by the Federal Reserve on both a daily and monthly basis. It is a weighted average of the foreign exchange values of the U.S. dollar against the currencies of a large group of major U.S. trading partners. The index weights, which change over time, are derived from U.S. export shares and from U.S. and foreign import shares. The data are noon buying rates in New York for cable transfers payable in the listed currencies. At SMU, we use the historical exchange rates published in the Oanda Forex trading platform to track the currency value of the U.S. dollar against that of 16 steel trading nations. Oanda operates within the guidelines of six major regulatory authorities around the world and provides access to over 70 currency pairs. Approximately $4 trillion U.S. dollars are traded every day on foreign exchange markets.