Market Data

May 22, 2019
Currency Update for Steel Trading Nations
Written by Peter Wright
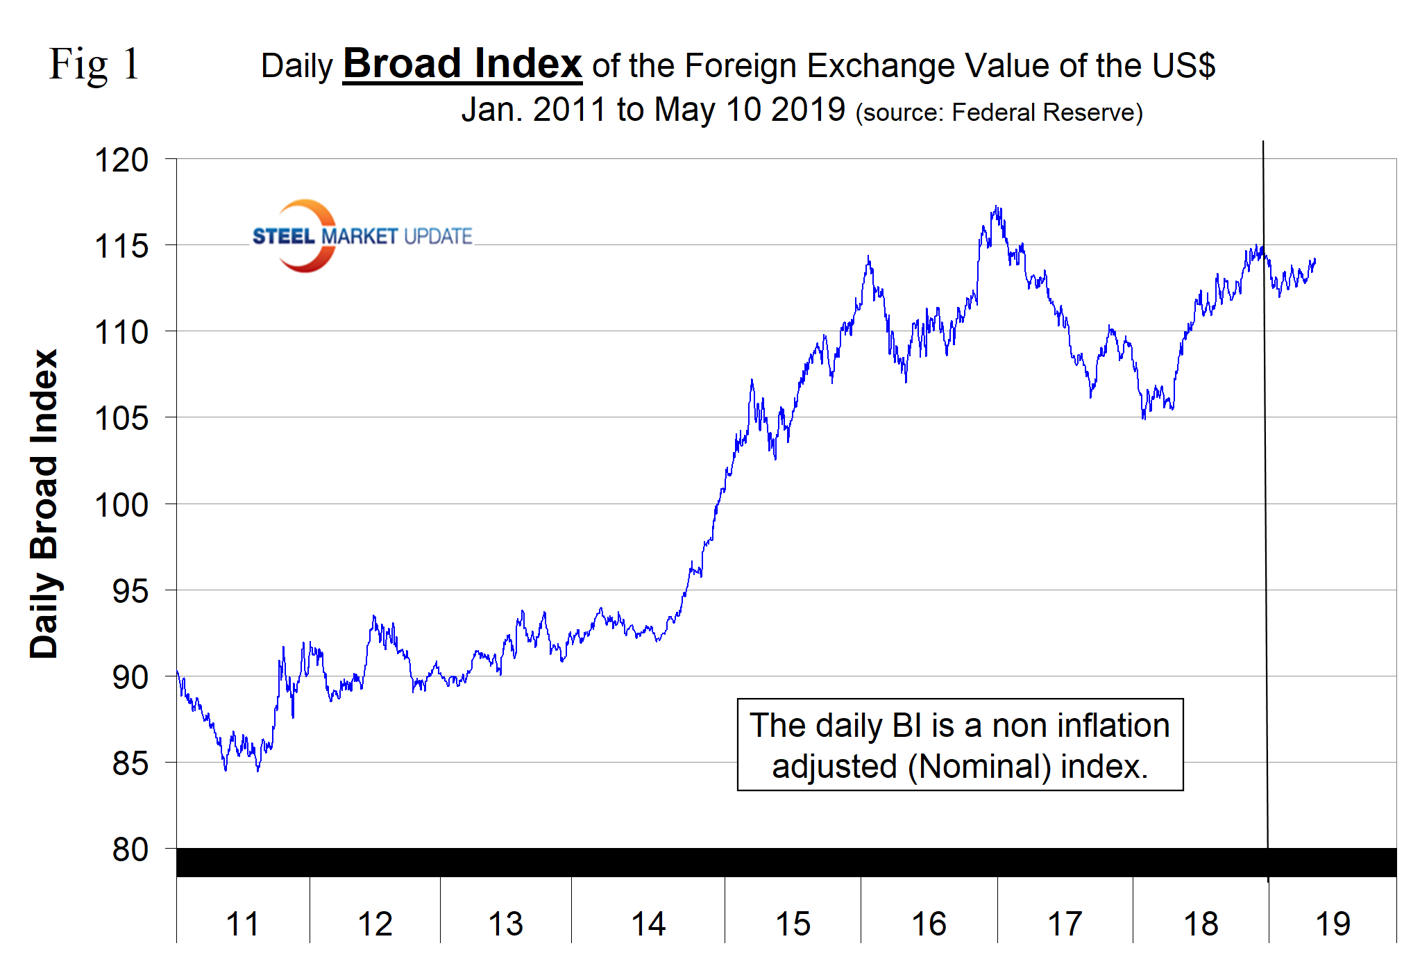
In this report, we examine the change in currency values of the 16 pre-eminent global steel and iron ore trading nations. The currencies of these 16 don’t necessarily follow the broad index value of the U.S. dollar. In fact, at any given time, some are always moving in the opposite direction. The latest value of the Broad Index as published by the Federal Reserve was May 10. In three months prior to that date, the dollar had strengthened by 0.9 percent, most of which occurred in the previous 30 days. Three currencies declined significantly in the last one month and three months. In this report, we will examine the history of the Brazilian real, the South Korean won and the Turkish lira. (See the end of this report for details of data sources.)
![]()
On May 9, Andrew Hecht, a long horizon analyst, wrote: “One of the primary determinants of the price levels of one foreign exchange instrument versus another is the yield that a currency offers holders. Since the euro, the yen, and the dollar are the three reserve currencies in the world, the current level of yield differentials makes a compelling case for a stronger dollar. Short-term euro and yen yields controlled by the European Central Bank and the Bank of Japan stand in negative territory at around the negative 40 basis points level. Sluggish economic growth in Europe and Japan have caused a prolonged period of accommodative monetary policy to stimulate the respective economies. In the U.S, GDP is growing at a moderate pace and unemployment is at its lowest level since the late 1960s. After liftoff from a zero percent Fed Funds rate in December 2015, the short-term rate currently stands at the 2.25-2.50% level. The rate differential of 2.45-2.90% is one of the most significant factors when it comes to the price path of the dollar versus its counterparts, which are also reserve currencies. The long-standing inverse relationship between the dollar and commodity prices goes hand-in-hand with interest rates. Since the dollar is the pricing mechanism for most commodities, a higher dollar and rising interest rates create a bearish cocktail for raw materials for two reasons. First, higher rates increase the cost of carrying inventories and long positions in the commodities markets. Commodities, like other assets, compete for capital flows, and higher rates tend to attract investment capital to the bond market. The second reason is that a stronger dollar leads to higher commodities prices in other world currencies. Commodity production is a local affair; it occurs in parts of the world where the crust of the earth is rich in energy, metals, ores, and minerals or where the soil and climate support crops. A higher dollar and weaker currencies in countries outside the U.S. lead to higher local prices, which incentivize producers to increase their output leading to growing supplies and inventories, which puts pressure on prices. Therefore, the U.S. dollar and U.S. interest rates by extension are a leading factor when it comes to the prices of raw materials around the globe.”
On May 10, Swiss Financial Consulting SA wrote (paraphrased by SMU): Even as the Fed claims that it will be patient, one wonders what is going to happen as the federal debt increases at a fast pace. The budget deficit for 2019 will be close to around one trillion and the 2020 budget deficit is projected to be over one trillion. The massive federal debt is going to be a drag on the economy, and the strength of the U.S. dollar should not be taken for granted. Present interest rates help to strengthen the dollar but also result in higher costs for the Treasury to service the debt. It is highly likely that the Fed will end up acquiring large amounts of Treasury paper in order to provide the necessary liquidity if capital markets don’t make available the amounts needed. If the Fed raises interest rates to fend off higher inflation, then the U.S. dollar should strengthen still more. If the Fed lowers rates in case of a recession and economic duress, then the dollar would probably suffer in the Forex markets. The U.S. dollar is still going strong. There are, however, various scenarios that could result in a fall in the value of the dollar. If the China-U.S. trade war is not settled by an agreement, then the dollar could suffer as the global economy absorbs the fall in trade that would probably result. Demand for the dollar could also decrease due to the development of an alternative international payment system worked out by China and Russia. Then there is the recently established oil futures market in Shanghai, which favors the renminbi as the currency for oil contracts. Should Saudi Arabia no longer insist on payment for its oil only in U.S. dollars, then the petrodollar would undergo a cataclysmic disaster very quickly instead of a slowly eroding position in the petroleum markets. In this context one should consider the long-term plans of China to promote the renminbi as an international reserve currency. If central banks decide to hold more gold in their reserves and more renminbi, then demand for the U.S. dollar would suffer. This process could take perhaps three to five years, but it will influence the value of the dollar.
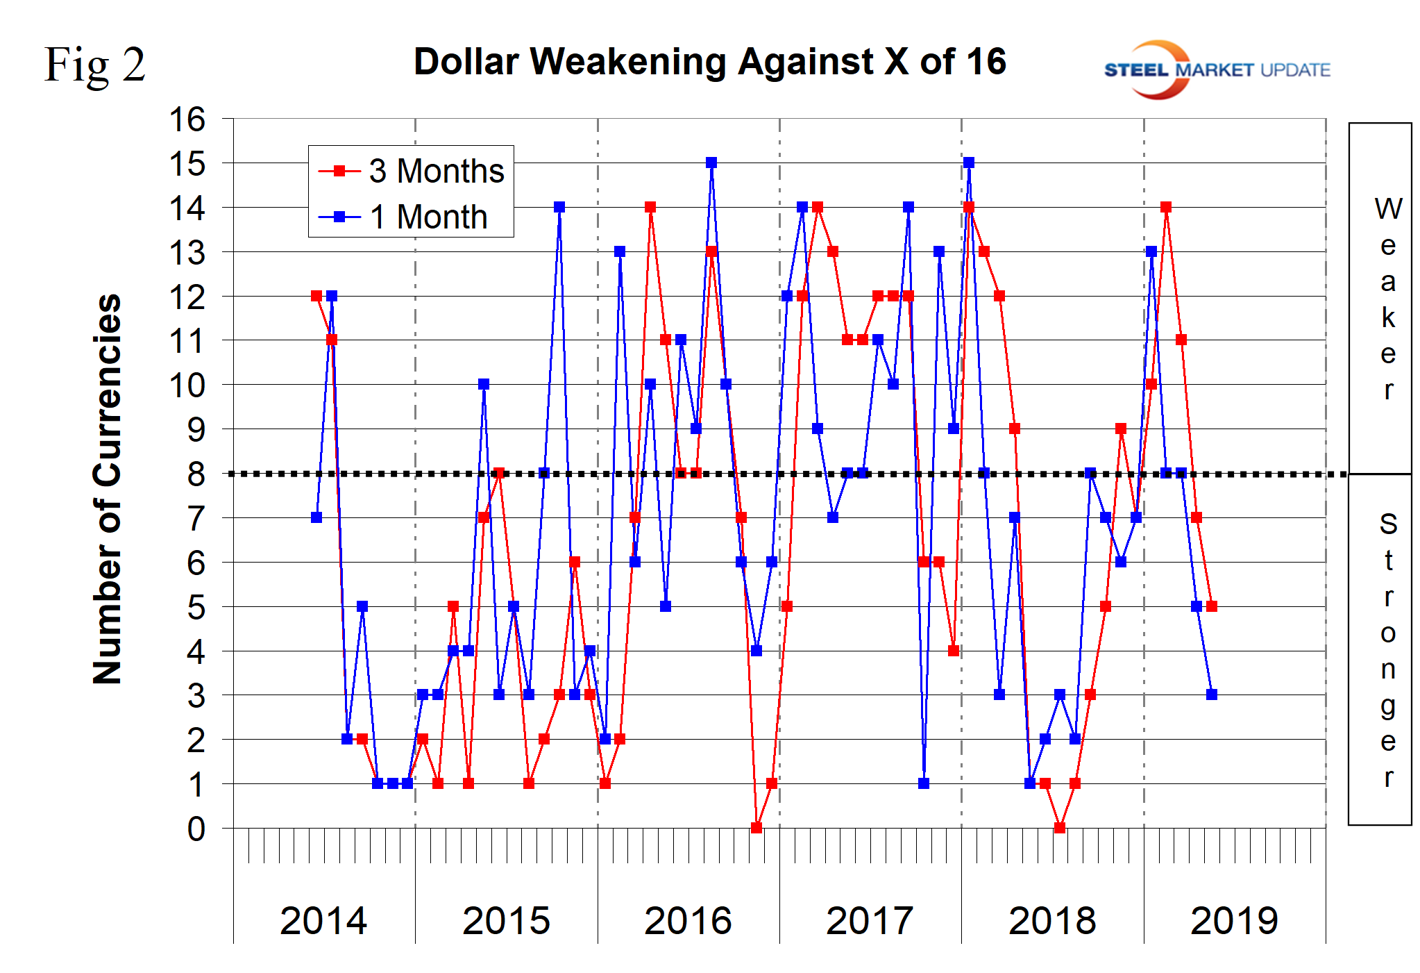
Figure 1 plots the Broad Index (BI) value of the U.S. dollar since 1995. This can be described in a number of different ways depending on what message the writer wants to send, all of which are true and some of which are contradictory. The BI is below its recent peak of December 2016, the BI is lower now than it was at the beginning of 2019, and the BI has risen by 1.8 percent since Jan. 31, 2019. Figure 2 shows the extreme gyrations that have occurred at the three and one month levels since the beginning of last year.
At SMU, we track the currencies of 16 steel trading nations. Table 1 shows the number of currency units that it takes to buy one U.S. dollar and the percentage change in the last year, three months, one month and seven days. The overall picture for the steel trading nations is that in the last year the U.S. dollar has strengthened against 13 of the 16 and weakened against three. In the last three months, the dollar has strengthened against 11 and weakened against five. In the last month, the dollar has strengthened against 13 of the 16 and in the last seven days has strengthened against 15 of the 16. Table 1 is color coded to indicate weakening of the dollar in green and strengthening in red. We regard strengthening of the U.S. dollar as negative and weakening as positive because of the effect on net imports.
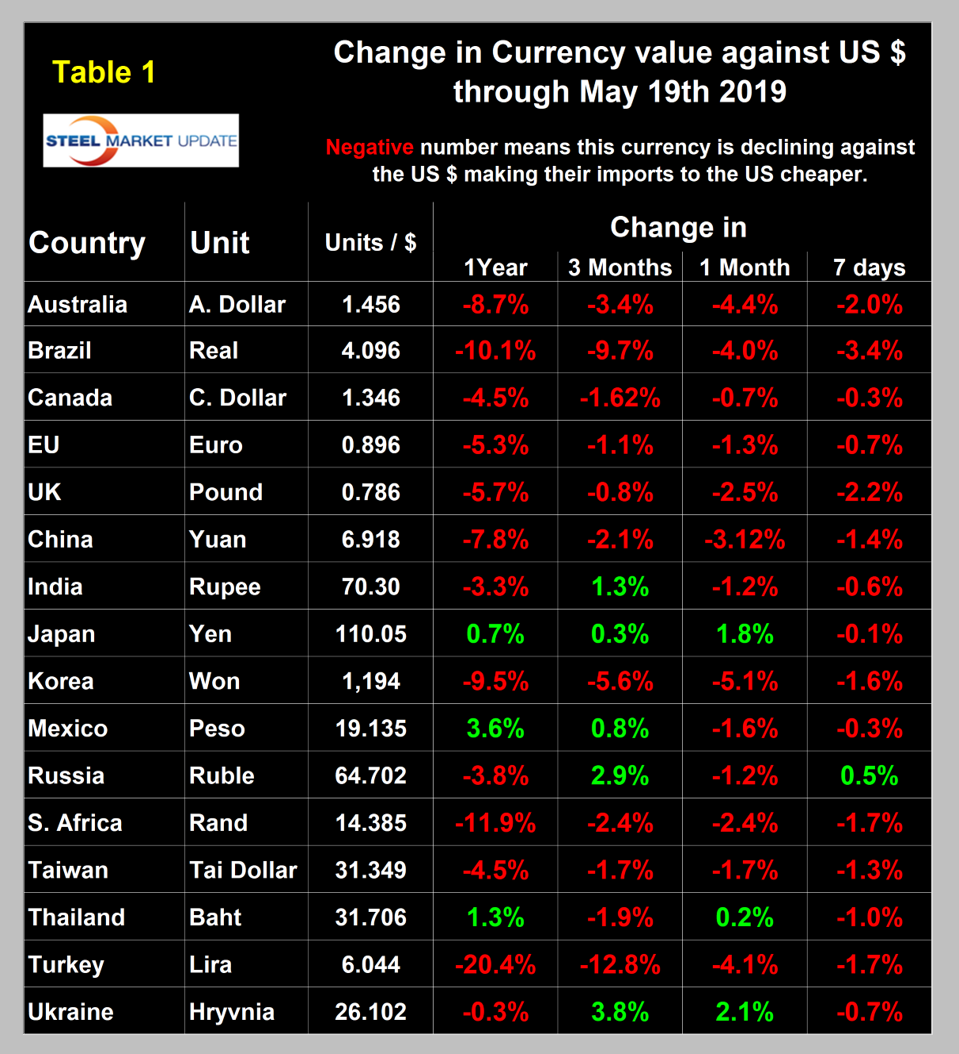
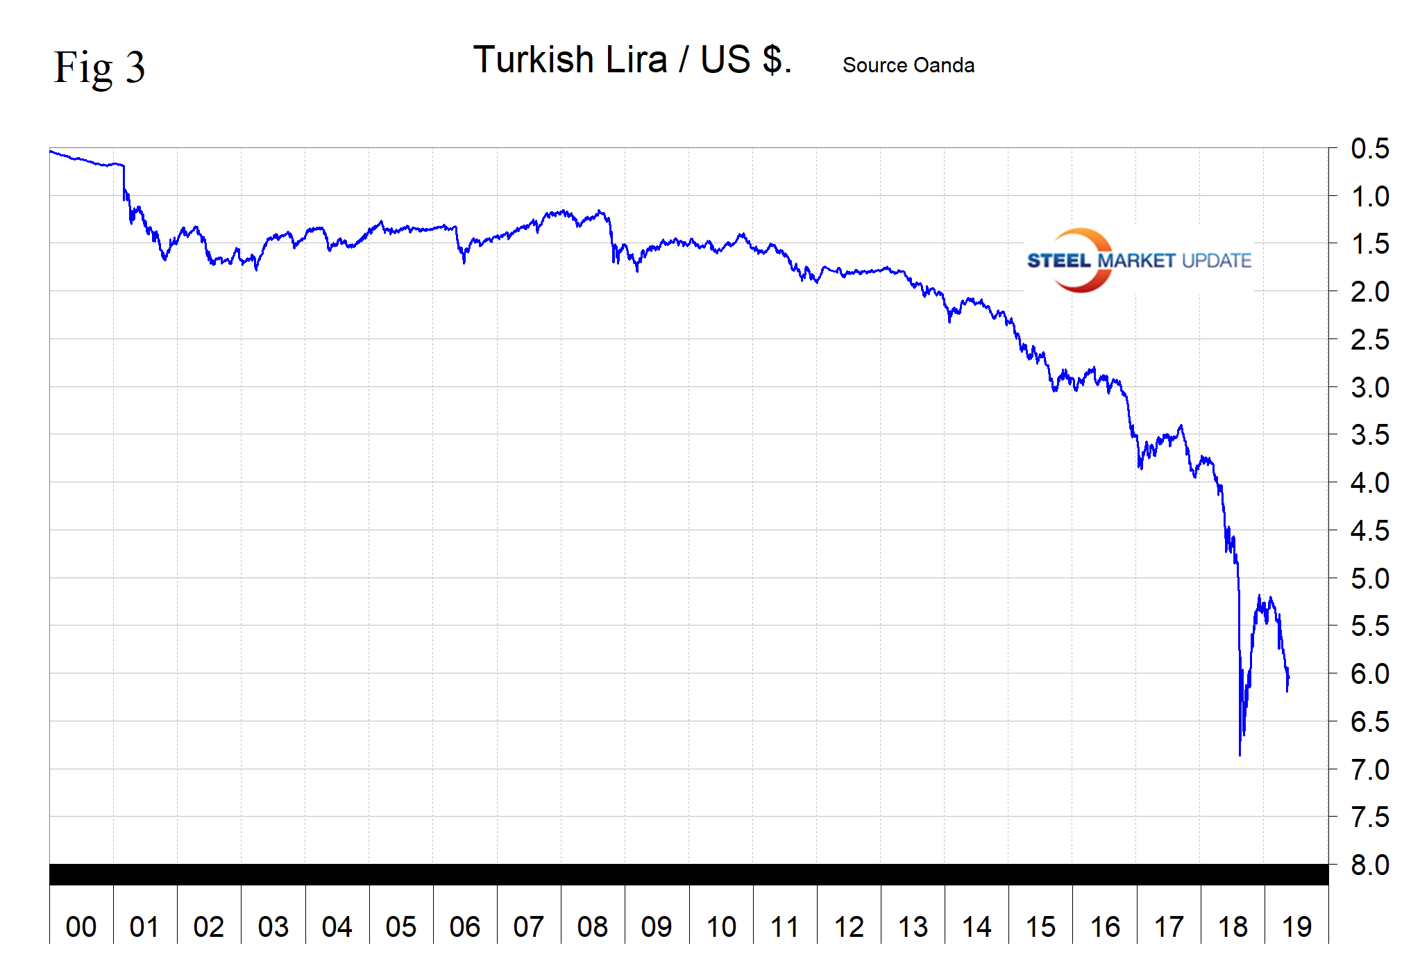
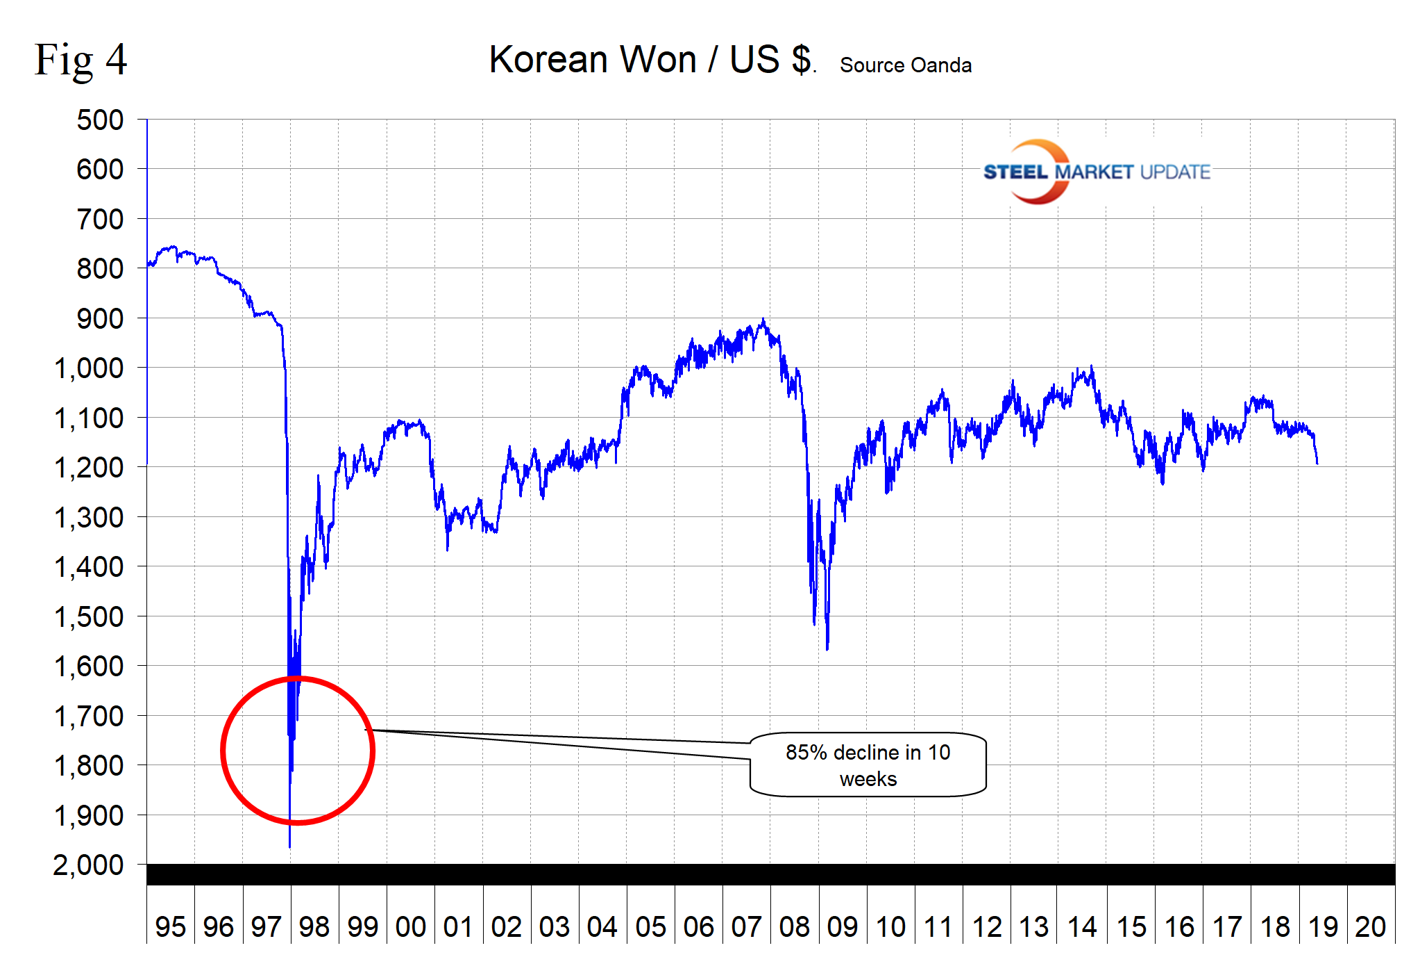
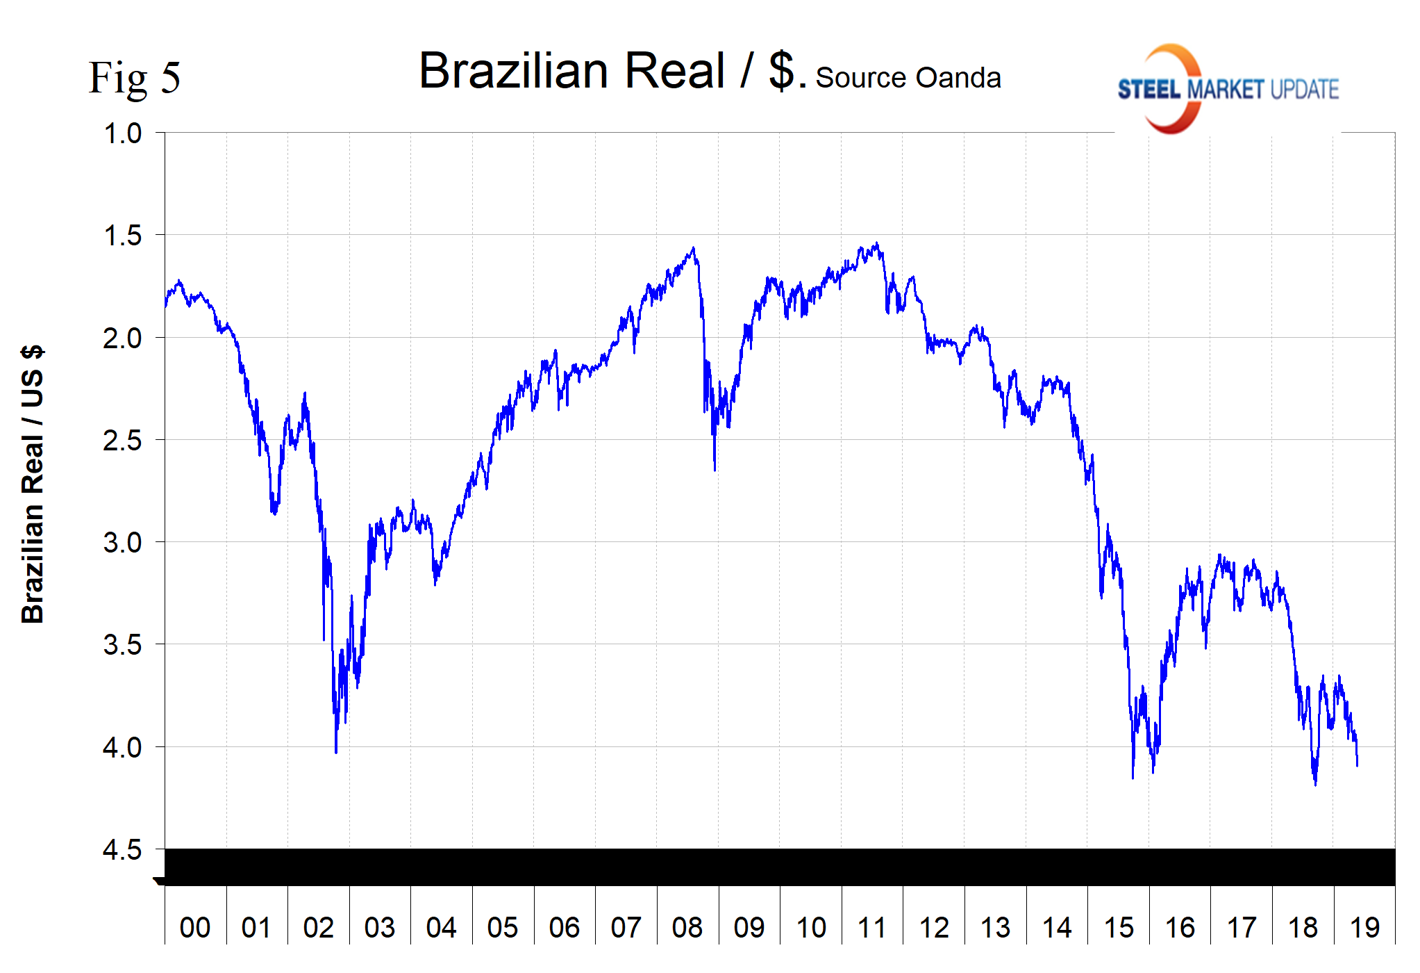
The following major changes have occurred in the last three months: the Turkish lira has declined by 12.8 percent and is down by 20.4 percent year-over-year. The Korean won has declined by 5.6 percent and is down by 9.5 percent year over year, and the Brazilian real has declined by 9.7 percent and is down by 10.1 percent year-over year. Figures 3, 4 and 5 show the long-term trend of these three currencies.
In this monthly analysis we show the trends that we think have the most immediate significance, but all 16 steel trading nation graphs are available on request if any reader has a special interest that we haven’t covered.
Explanation of data sources: The Broad Index is published by the Federal Reserve on both a daily and monthly basis. It is a weighted average of the foreign exchange values of the U.S. dollar against the currencies of a large group of major U.S. trading partners. The index weights, which change over time, are derived from U.S. export shares and from U.S. and foreign import shares. The data are noon buying rates in New York for cable transfers payable in the listed currencies. At SMU, we use the historical exchange rates published in the Oanda Forex trading platform to track the currency value of the U.S. dollar against that of 16 steel trading nations. Oanda operates within the guidelines of six major regulatory authorities around the world and provides access to over 70 currency pairs. Approximately $4 trillion U.S. dollars are traded every day on foreign exchange markets.


