Prices

May 16, 2019
HRC Futures: Breaking Down Further to $600 After Mnuchin’s Tariff Removal Comments
Written by David Feldstein
The following article discussing the global ferrous derivatives markets was written by David Feldstein. As an independent steel market analyst, advisor and trader, we believe he provides insightful commentary and trading ideas to our readers. Note that Steel Market Update does not take any positions on HRC or scrap trading, and any recommendations made by David Feldstein are his opinions and not those of SMU. We recommend that anyone interested in trading steel futures enlist the help of a licensed broker or bank.
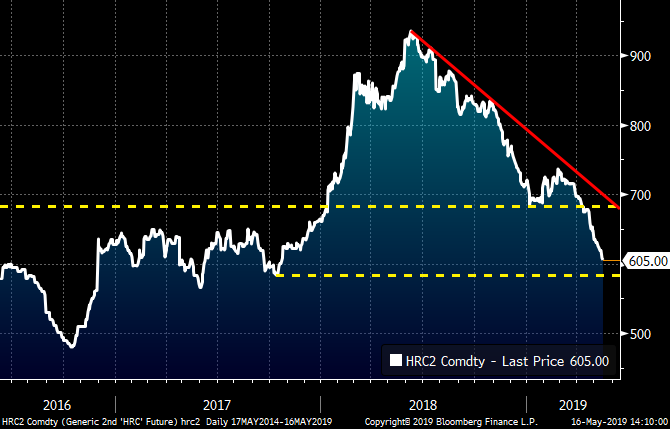
Near-term CME HRC futures continue to fall, dropping over $25 since May 2. Today, the June and July futures traded as low as $600 and are approaching the $585 support level indicated by the bottom yellow dashed horizontal line. If support in the $575-585 area fails, prices could be heading to $500. When prices broke through the $680 support level, the idea that the HRC price would need to make a sharp price move lower to a point that induces buyers to step in was expressed (see April 11 SMU). Since then, prices have fallen $80 in five short weeks, but that doesn’t seem to be enough? In fact, sentiment has rapidly deteriorated during that period.
Rolling 2nd Month CME Midwest HRC Future
Service center inventory data showed a sharp destocking at the beginning of 2019 that hasn’t been replaced. Is the $600 level low enough to get service centers to restock? Or do prices have to fall further and faster to entice the larger service centers to put their capital to work? Keep an ear out for rumors of transactions of massive tons placed at a steeply discounted eye-opening price.
As noted in my previous article, I have been thinking hard about what catalysts could rally the hot rolled market. Below is the HRC futures curve as of May 2 and last night. As you can see, the curve has shifted from an essentially flat curve to one in contango by almost $20. This is interesting on two fronts.
CME Midwest HRC Futures Curve
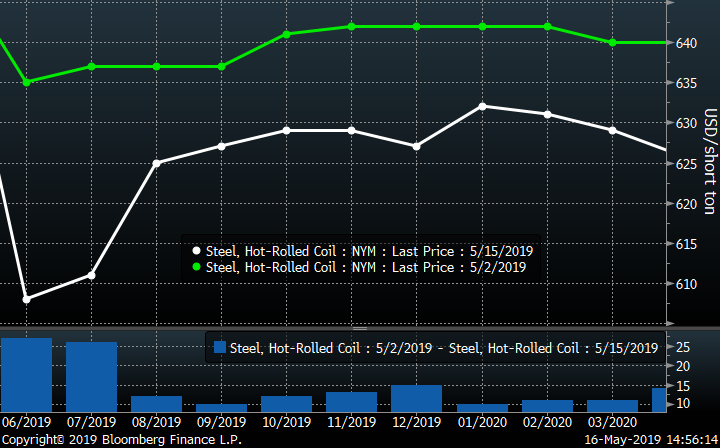
First, without getting too wonky, a curve in contango indicates a positive convenience yield, i.e. a benefit to holding physical over paper. To put simply, the futures curve is expressing inventory is too low. We already know service center inventory is lean and can make an educated guess that OEMs are lean on inventory. However, data from the publicly traded steel mills’ recent earnings reports, combined with the excessive crude production levels evidenced by the AISI data, contradicts this idea of “low inventory.” Rather that the mills are holding the inventory as opposed to the service centers and OEMs. Regardless, the curve is warning that given a positive change in demand, sentiment or a supply shock, a sharp rally could occur. Whether that happens off $600 or $500 is anybody’s guess.
Second, this contango opens an opportunity to manage this potential upside risk. Buying the front months of June and July and selling August and September is one approach. If the sell-off is deep and long lasting, prices will continue to fall with the longer dated months settling at much lower prices than the near-term ones. If the market suddenly rallies sharply, the contango will quickly reverse offering a profit of $20 simply on the curve flattening and potentially a larger gain as the curve likely heads back into backwardation and HRC pricing remains in a bear market.
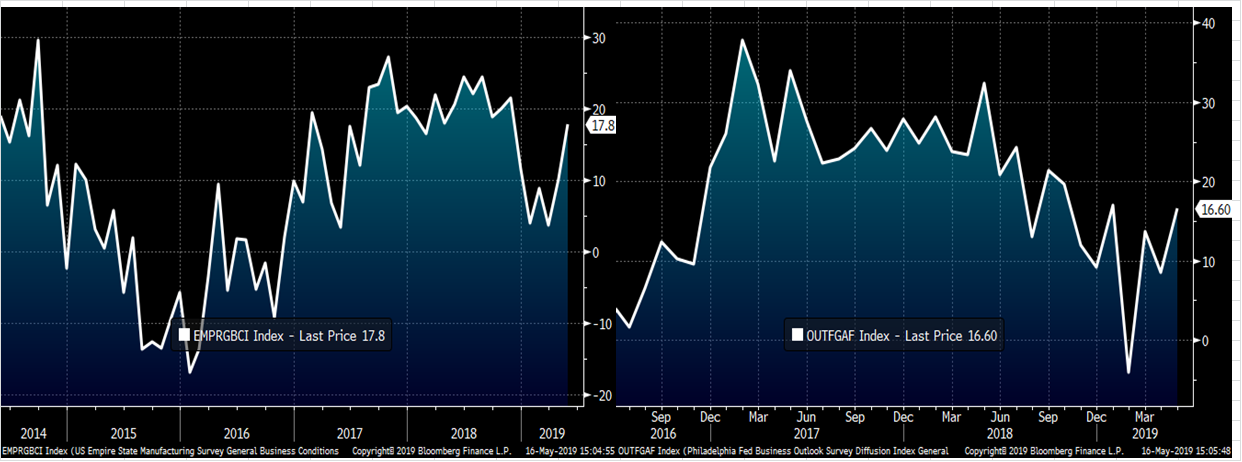
At this point you might be confused. You might be asking yourself, is Feldstein bullish or bearish? HRC at $600 is a lot more attractive than HRC at $720 and value is critical; however, so is timing. This week we saw two solid regional manufacturing reports with the Empire and Philadelphia Indices jumping noticeably. Interest rates and mortgage rates have fallen sharply, which should boost the home sales. The construction projects that have been delayed by flooding and underwater foundations will start soon. Taken together, this could improve things for the construction industry and demand for construction products. WTI crude oil closed above $63/bbl today with the looming threat of oil prices spiking overnight with any escalation in the situation with Iran. Surely, these fundamentals look different when compared to $720 tons vs. $600 tons.
May Empire Manufacturing & Philadelphia Fed Indices
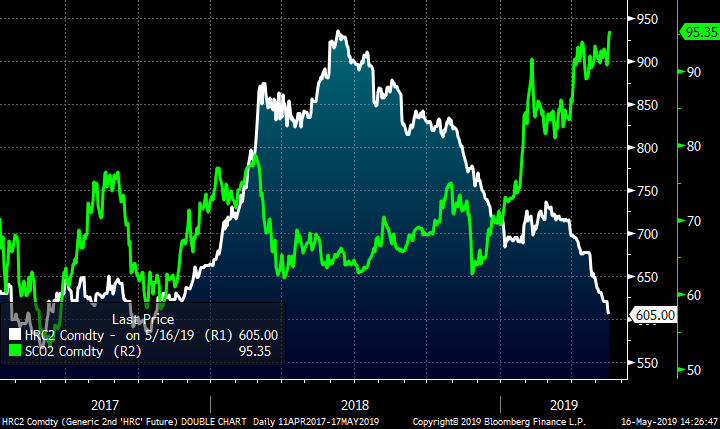
Meanwhile, iron ore prices continue to rally sharply closing last night at $95.35/t while diverging significantly from Midwest HRC.
2nd Month CME HRC Future (white) & 2nd Month SGX Iron Ore Future $/t (green)
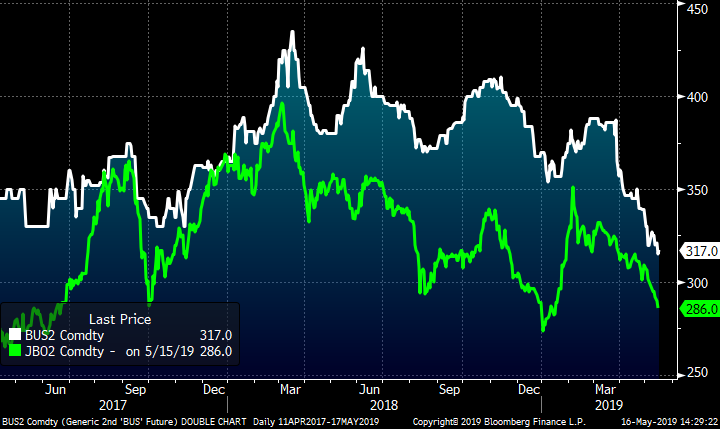
Nevertheless, scrap prices continue to crater and domestic steel mills continue to over-produce.
The developments around the USMCA–which started on April 28 with Iowa Senator Chuck Grassley’s Wall Street Journal op-ed and then was followed yesterday with Treasury Secretary Mnuchin’s comments that a deal is close that would remove the 25 percent tariffs on steel imported from Canada and Mexico–look to be taking $10-$15 chunks out of near-term HRC futures after each incident.
2nd Month LME Turkish Scrap & 2nd Month CME Busheling Futures
If the steel tariffs placed on Canada and Mexico are officially removed, futures could get hit by another $30-$50 AND then the Bicameral Congressional Trade Authority Act of 2019, which looks to remove all steel tariffs, will start to march forward. These powerful issues are negatively affecting sentiment, creating massive uncertainty and risk aversion.
The market is best defined as tenable and significant volatility looks to continue in the coming weeks and months. The $600 level doesn’t look to be attractive enough yet for buyers to step in. However, prices in the $500-$550 range look to be sufficient at the moment. Waiting for a really juicy buying opportunity looks to be the shrewdest move for now; however, it might come at the cost of missing a nice short-squeeze. The best trade still looks to be what has been working all year….take incremental profits on your shorts and keep some powder dry for the eventual short squeezes and sell, sell, sell into the rally.
Rolling 2nd Month CME Midwest HRC Future
