Prices

April 11, 2019
HRC Futures: Breaking Bad to New Multi-Month Lows
Written by David Feldstein
The following article discussing the global ferrous derivatives markets was written by David Feldstein. As an independent steel market analyst, advisor and trader, we believe he provides insightful commentary and trading ideas to our readers. Note that Steel Market Update does not take any positions on HRC or scrap trading, and any recommendations made by David Feldstein are his opinions and not those of SMU. We recommend that anyone interested in trading steel futures enlist the help of a licensed broker or bank.
The downtrend that started in June 2018 continues as settlements remain below the downward trend line pictured below (red) with the trend evolving with lower highs and lower lows. As noted in previous articles, the 2nd month (May) Midwest HRC future is unequivocally in a bear market.
Rolling 2nd Month CME Midwest HRC Future
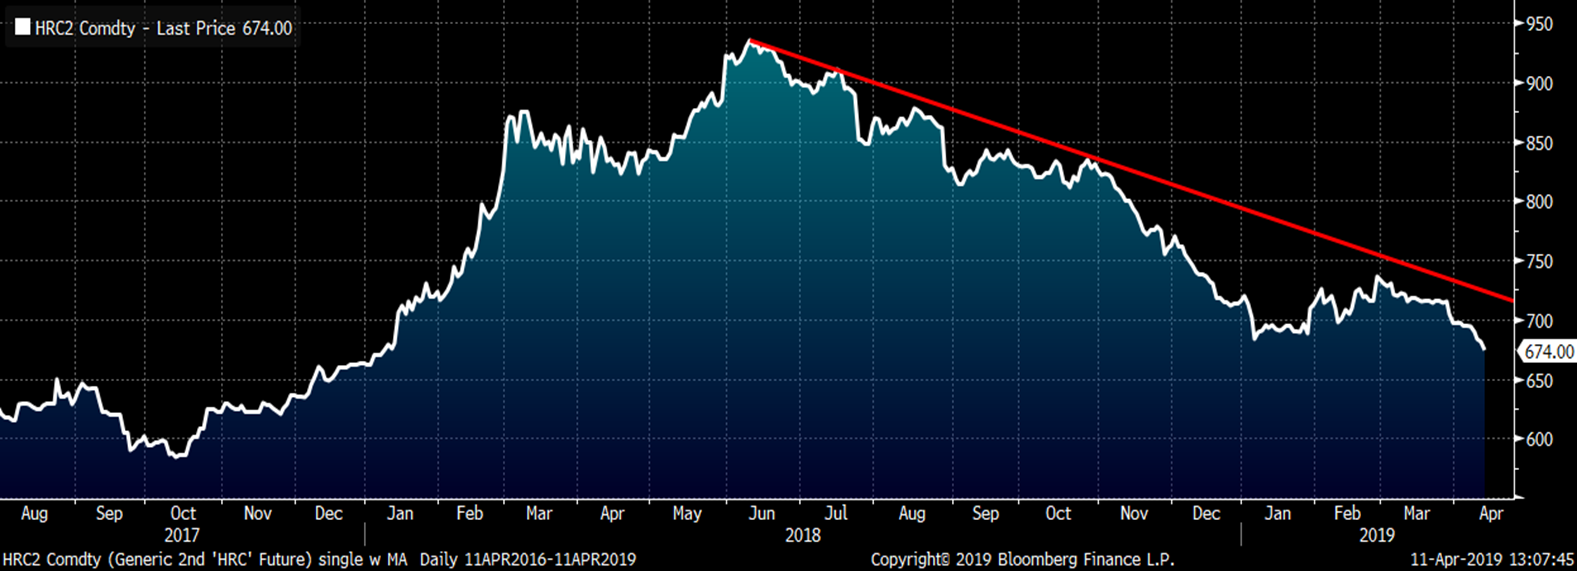
The 2nd month CME Midwest HRC future settled Wednesday night at $681, just below the $683 low seen in early January. This is a very tricky price point.
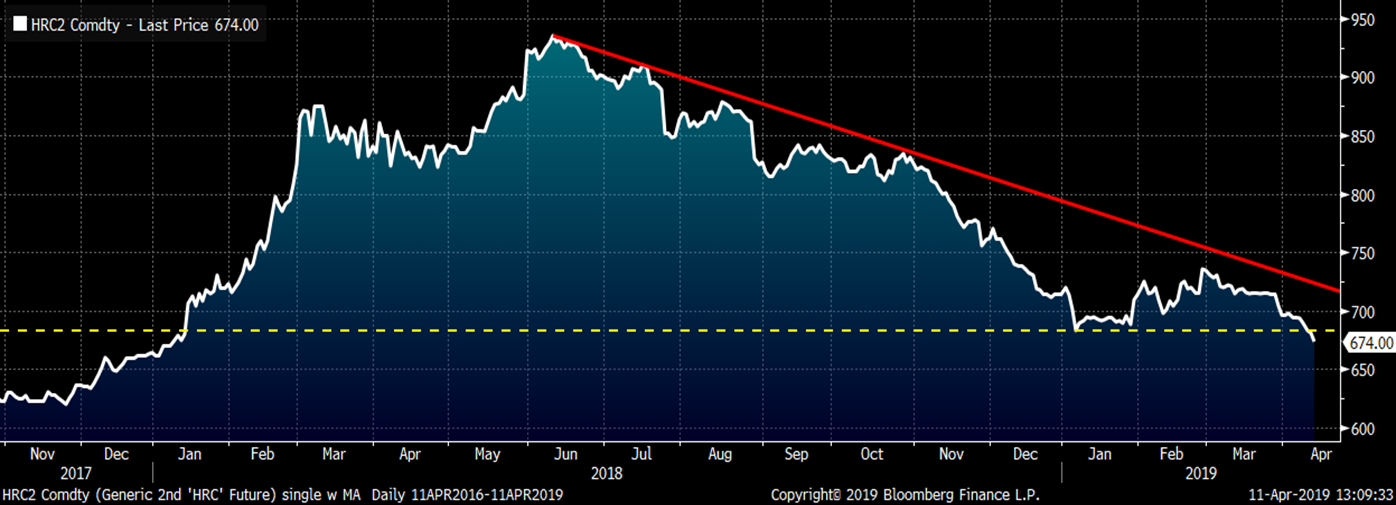
One of two outcomes is most likely to happen. The first is a double bottom where the 2nd month HRC future bounces off the $680 level. A double bottom is a bullish pattern where prices trade back to a previous low, find support at that low and then rally. This pattern typically signals the end of the sell-off or bear market and the beginning of a new rally or bull market.
The second possibility is that the market breaks to new lows. Today the 2nd month future clearly broke through the bottom of the range with 3,500 tons trading at $675, a new multi-month low.
Breaking through the previous low is especially risky and poses major downside price risk because buyers tend to pull their bids at these inflection points leaving little liquidity to meet the growing volume of sellers. The result of this sudden buy side illiquidity is a sharp price move lower to a point that induces buyers to step in. This is typical behavior of any market.
Rolling 2nd Month CME Midwest HRC Future
Early in my trading career, my first boss told me “anyone can make money in a bull market; it’s the bear markets that separate the strong traders from the weak.” So, how do you trade a bear market? Very carefully!!
First, look to sell the rallies. The rallies offer risk/reward scenarios that can be quantified. For instance, the most recent high or the down trend line provide a nonrandom level, which can be used as an exit or stop-loss point. Since this is quantifiable, one can reasonably define the amount risked being the difference between the sale price and the exit point at which a loss is realized. A typical trader fundamental is a 1:2 or 1:3 risk/reward ratio. So if you sell a June future at $720 with a plan to take a loss if the future trades above $745, i.e. risking $25, then you need to make between $50-$75 to justify the trade and should thus target profit taking in the $645-$670 range.
Second, take your profits when you can, don’t get greedy and don’t panic. Another characteristic of a bear market are explosive short covering rallies. As bear market sell-offs gets exhausted, those with profits start to get nervous and like a gunfight in a crowded room full of cowboys, somebody shoots first and then all hell breaks loose. The illiquidity shifts to the sell side and prices run up. Weak-minded and/or inexperienced traders and those with weak short positions watching their profits quickly evaporate tend to panic and buy in their short positions regardless of price or whether the price they are paying is even logical. This is the short squeeze and this is where an astute seller wants to be in position to sell. This is where you find the proverbial low hanging fruit.
Last, bear markets see prices move to extremes mostly caused by short-term bursts of illiquidity. Market participants panic on both the buy and sell side. Typically, prices move to a relatively extreme level for a very brief time as sellers pile on and nervous or greedy buyers head to the sidelines (or vice versa in a short-squeeze as explained above). Sun-Tzu said “every battle is won before it’s ever fought.” Define the trade with a cool head. Trade the extremes and don’t change your strategy when things get hot and the emotions of greed and fear influence and bias your decision-making.
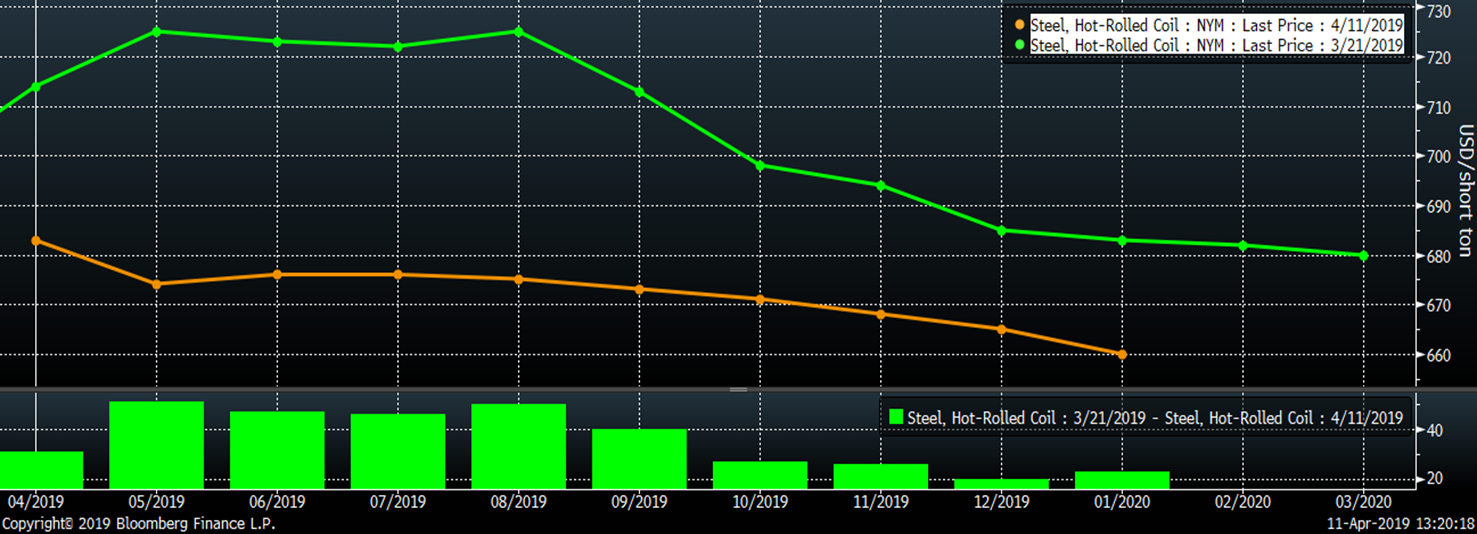
The chart below compares the CME Midwest HRC futures curve today versus March 21. The histogram at the bottom shows prices in the May-September futures have dropped $40-$50 in three weeks. Also, the curve has flattened dramatically with November now only $5 below May vs. $30 below May back on March 21.
CME Midwest HRC Futures Curve
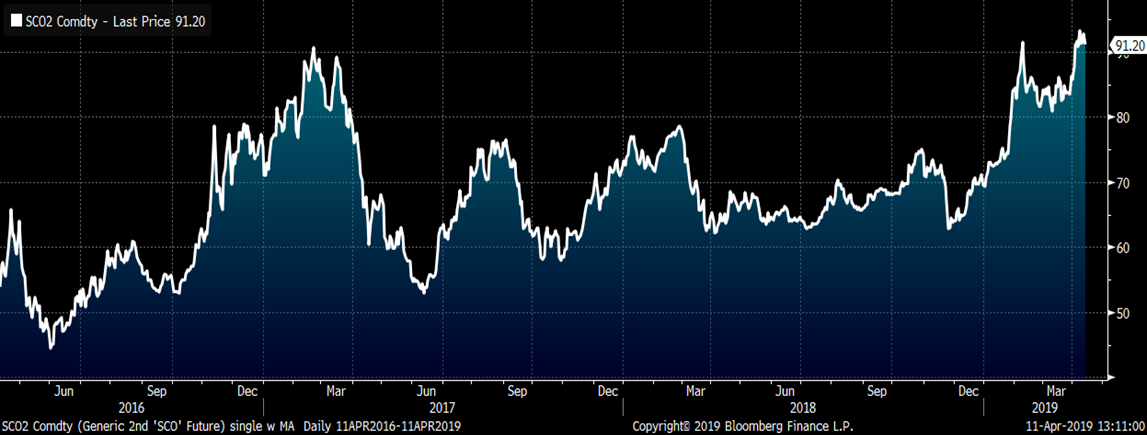
The 2nd month SGX iron ore future settled at a multi-year high last week before settling today at $91.20t.
2nd Month SGX Iron Ore Future USD/t
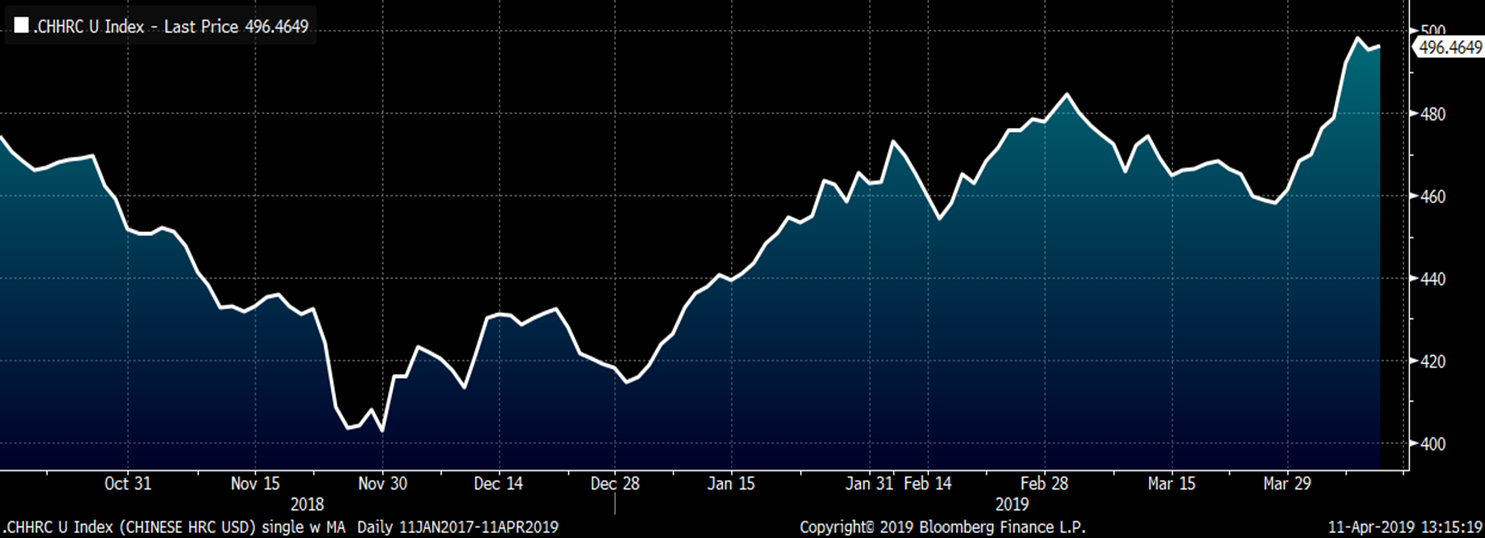
The (most active) October Shanghai Futures Exchange Chinese HRC future has traded higher along with iron ore settling today at $496.50 USD/st.
October Shanghai Futures Exchange Chinese HRC USD/st
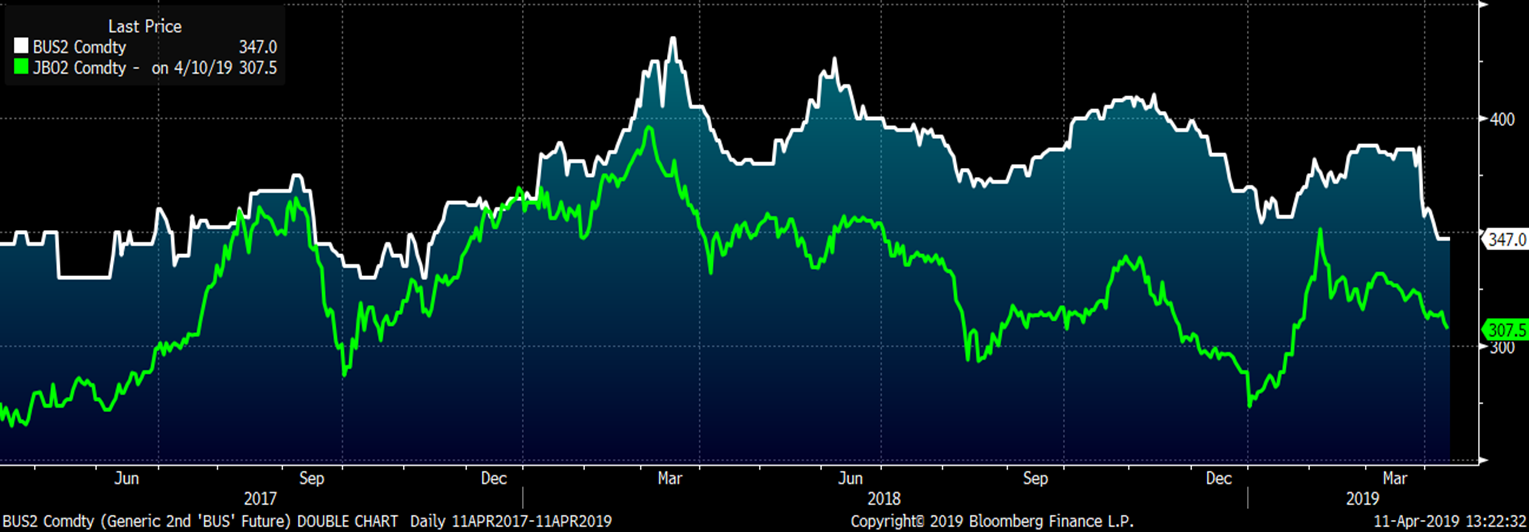
However, scrap prices have diverged from iron ore with 2nd month busheling falling to the lowest level since November 2017, settling last night at $347/lt, while 2nd month LME Turkish scrap has also continued to fall since its post Brazilian dam break peak in mid-February, settling today at $307.50/t.
2nd Month LME Turkish Scrap & 2nd Month CME Busheling Futures
On Monday, March 11, the London Metals Exchange launched a number of new products, one of which was a cash settled futures curve based on the Platts TSI Daily U.S. Midwest HRC Index. This coming Monday, April 15, the CME is launching a new U.S. Midwest HRC futures curve settled on the exact same Platts TSI Daily U.S. Midwest HRC Index. Click this link to view the press release.


